Debsie analyzed public child-health and education data to understand when screen time becomes a real school risk – and what families can do about it without turning daily life into a fight.
For journalists, researchers & editors
A compact source box for people who may want to quote, cite, or reference this report. Regular readers can skip this section.
Journalist Summary Fast facts, caveats, and story angle
Debsie analyzed public 2024 National Survey of Children’s Health data, CAHMI/DRC query outputs, OECD PISA 2022 reporting, and pediatric/public-health guidance to understand how recreational screen time relates to school routines.
The main finding is not that screen time automatically lowers grades. The stronger conclusion is that recreational screen time becomes a bigger learning risk when it replaces sleep, homework, reading, focused attention, movement, or active learning.
This report should not be read as a causal claim that a fixed number of screen hours directly lowers grades. It is better read as a routine-risk analysis: screen time matters most when it crowds out the daily habits that support learning.
Cite This Report Suggested citation for articles and research notes
Debsie. “Screen Time, Sleep, Homework, and Grades: What Public Data Really Shows.” Debsie, July 3, 2026. Based on public 2024 National Survey of Children’s Health data, CAHMI/DRC query outputs, OECD PISA 2022 reporting, and pediatric/public-health guidance.
Media and research references should credit Debsie.com and link back to this report page.
| Research note for transparency This research article uses public aggregate data from the 2024 National Survey of Children’s Health (NSCH), public NSCH data-query outputs from CAHMI/DRC, OECD PISA 2022 reporting, and guidance from pediatric and public-health sources. It reports patterns, practical risks, and family actions. It does not claim that screen time alone causes lower grades. |
| Why is this relevant? The research is relevant because 2024 NSCH is currently a very fresh public dataset. The U.S. Census page lists the 2024 NSCH Data Release and access to 2024 public-use microdata, with the release page dated November 17, 2025. So for this 2026 research article, 2024 is not old; it is the latest public survey cycle available for that source. The broad question is not unique. “Does screen time relate to grades?” has already been studied. The Debsie research becomes more useful as we stop asking that broad question and ask a sharper, more useful one. When children have high entertainment screen time, is the academic risk mainly about screen hours themselves, or about what those hours replace: sleep, homework, focus, reading, movement, and family routines? |
| The main conclusion The best question is not only “How many hours of screen time?” The better question is “What did the screen replace?” The school risk becomes more serious when recreational screen use pushes out sleep, breaks homework focus, weakens attention, or turns learning time into distraction. The most important idea is this: Screen time may matter less as a number and more as a replacement. A child who uses screens for two hours after homework, sleeps well, reads daily, and stays active is not in the same situation as a child who uses screens during homework, sleeps late, skips reading, and wakes up tired. Both may have “screen time.” But the learning risk is totally different. |
Key Findings
- Heavy recreational screen use is common enough to matter. In the 2024 NSCH weighted data, 22.8% of U.S. children were reported to spend 4 or more weekday hours on recreational screen use. Among valid responses only, the share is 23.3%. [2]
- The grade data does not support panic. Among school-age children with valid letter-grade reports, 79.3% were reported to receive mostly A’s or mostly A’s and B’s. This is why the takeaway should not be “screens destroy grades.” The data points to a more balanced conclusion: screen habits become risky when they weaken sleep, homework, focus, and routine. [2]
- Sleep is a serious routine signal. Among school-age children with valid sleep responses, 17.5% were reported to average under 8 hours of sleep in the past week. Because this is an age-mixed group, the figure should be read as a routine signal, not a medical diagnosis for every child. [2]
- Homework is the first routine to protect. Among school-age children with valid responses, 86.3% were reported to always or usually do all required homework. That makes homework a practical anchor for screen-time rules. [2]
- OECD PISA 2022 reporting shows a non-linear pattern: moderate digital leisure outside school is not the same as heavy digital leisure or device use during school. This supports a pro-learning position, not a blanket anti-screen position. [6][7]
The Simple Answer Is Not Good Enough
Parents often ask one direct question: how much screen time is too much? It sounds like the right question. It is easy to count hours. It is easy to argue over a number. It is also easy to miss the real problem.
A child who spends two hours in a live online math class is not doing the same thing as a child who spends two hours scrolling short videos. A student who plays a chess lesson after homework is not in the same position as a student who checks messages every three minutes while trying to study. The number of hours matters, but it does not tell the whole story.
The better question is this: what did the screen replace? Did it replace sleep? Did it break the homework block? Did it push reading, outdoor play, family talk, or quiet practice out of the day? Did it turn a focused study session into a distracted one?
That is the core lesson from this research. Screen time becomes most worrying when it crowds out the daily habits that help students learn. Heavy entertainment use matters. But the strongest parent action is not a blind ban. It is a better routine.
How We Used the Data
For this research article, Debsie used public aggregate data from the 2024 National Survey of Children’s Health, also called NSCH. The NSCH is a large U.S. survey about children ages 0 to 17. It is funded and directed by HRSA’s Maternal and Child Health Bureau and administered by the U.S. Census Bureau. [1]
The main screen-time variable asks how much time a child usually spends on most weekdays with a TV, computer, cellphone, or other electronic device for programs, games, internet, or social media. The question clearly says not to include schoolwork. That detail matters because it makes the measure closer to recreational screen use, not learning time. [3]
We also used NSCH public aggregate data on reported grades, average sleep in the past week, homework completion, caring about doing well in school, finishing tasks, and staying calm when challenged. These are parent-reported survey answers. They are not perfect. But they are useful because they show the routines around screen use.
We also reviewed OECD PISA 2022 reporting on digital leisure and math performance. PISA gives a direct academic-performance lens because it studies 15-year-old students across many countries. That is important because the public aggregate NSCH tables do not cross-tab screen time and grades in one simple table. [6][7]
What This Research Can And Cannot Claim
This research aims to show that heavy recreational screen use is common, that many children still report strong grades, that sleep and homework are important daily routines, and that PISA reporting suggests the relationship between digital leisure and academic performance is not a simple straight line.
This research doesn’t claim that a specific child’s grades will fall because of a specific number of screen hours. It also cannot claim that four hours of screen time directly lowers grades by a fixed percentage. The data used here does not support that kind of headline.
Screen time is a risk signal when it is heavy, poorly timed, or unmanaged. It becomes more serious when it happens during schoolwork, pushes bedtime later, or removes practice time.
Finding 1: Heavy Recreational Screen Use Is Common Enough To Matter
The 2024 NSCH public table shows that recreational screen use is not a small issue. In the weighted data, 22.8% of children were reported to spend four or more weekday hours on recreational screen use. When we remove non-responses and look only at valid answers, that becomes 23.3%.
This does not mean every child in the 4-hour group is struggling at school. It does mean heavy screen use is common enough for parents, schools, and tutoring programs to treat it as a real learning-routine issue.
The largest group was the 2-hour group, at 26.8% of valid responses. That middle zone matters. Many children use screens daily. The goal is to make that use more intentional, not to pretend families can remove every device.
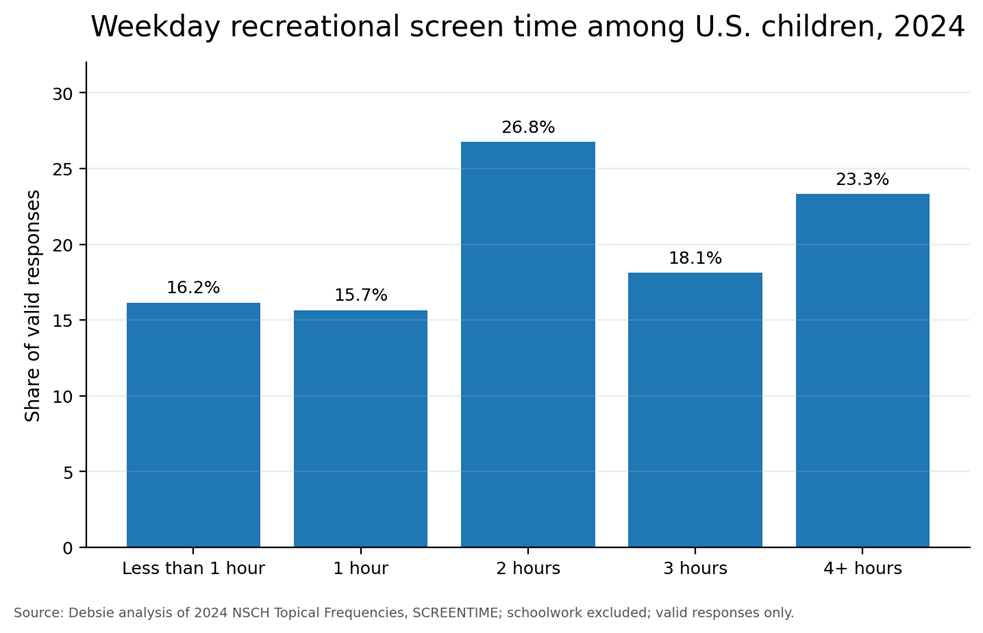
Figure 1. Weekday recreational screen time among U.S. children in 2024. Values are weighted and normalized to valid responses. Source: Debsie analysis of 2024 NSCH Topical Frequencies, SCREENTIME.
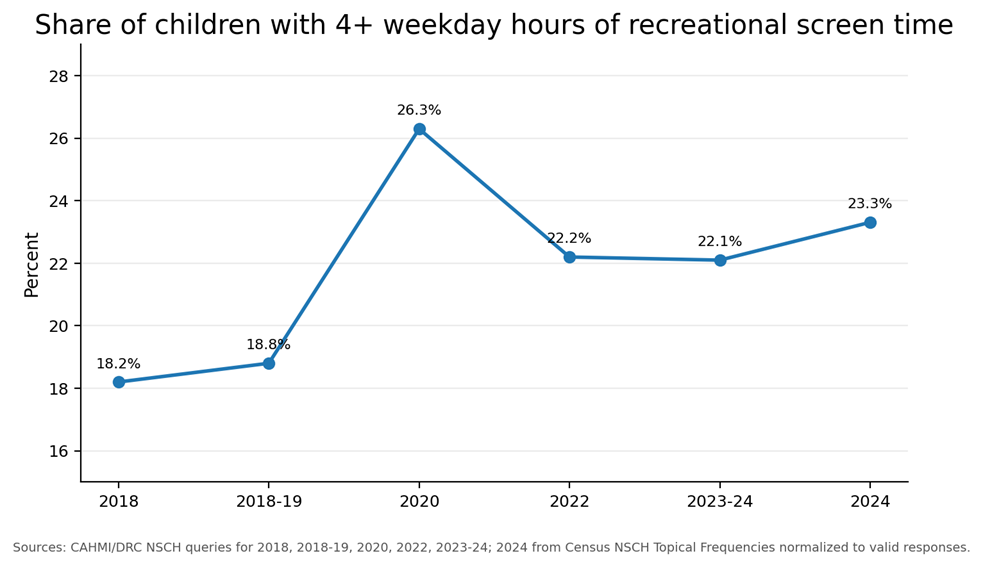
Figure 2. The 4-or-more-hours group rose sharply in 2020 and remained above the 2018 level in later public queries. The 2024 value uses Census frequency data normalized to valid responses; earlier values use CAHMI/DRC query outputs.
Finding 2: The Grade Data Shows There is Nothing To Panic
The 2024 NSCH grade table is a useful guardrail. Among children with valid letter-grade reports, about 37.2% were mostly A’s, and about 42.1% were mostly A’s and B’s. Together, that is 79.3% of valid letter-grade responses.
If most children with reported grades are in the higher-grade groups, the honest message cannot be that screens automatically destroy school performance.
The stronger message is more precise: heavy, unmanaged recreational screen use can become a school risk when it weakens sleep, homework, attention, motivation, or daily structure. That claim is more useful and more defensible.
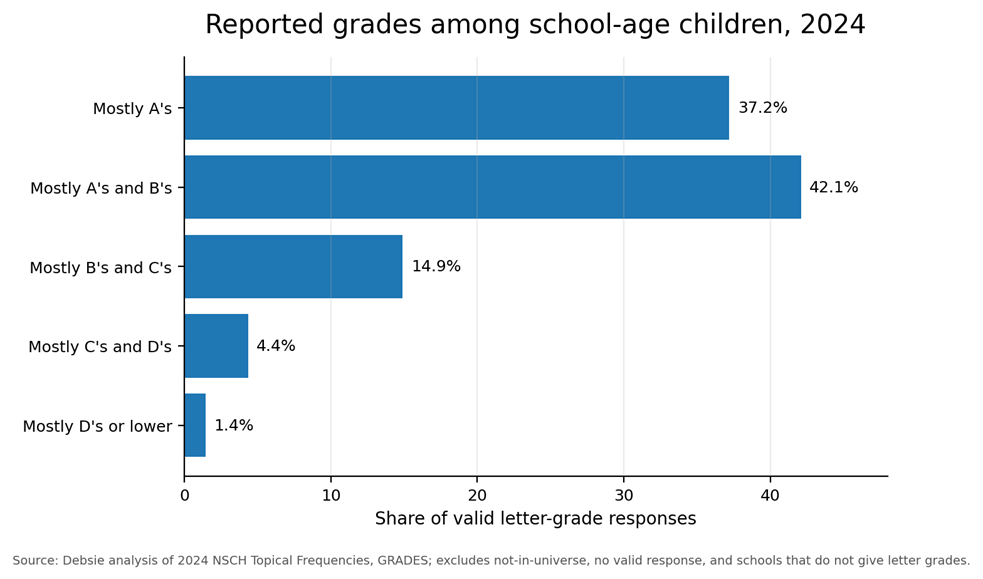
Figure 3. Reported grades among school-age children with valid letter-grade responses. Source: Debsie analysis of 2024 NSCH Topical Frequencies, GRADES.
Finding 3: OECD PISA Shows The Middle Zone Matters
OECD PISA 2022 adds a direct academic-performance lens. OECD’s reporting shows that students who spend a moderate amount of time on digital leisure before or after school can have higher math performance than students who spend very little or too much. In the OECD summary, the risk becomes clearer when leisure use outside school goes beyond 4 hours, and when students use leisure screens during school time. [6][7]
This is the key point: timing and setting matter. A student using a device for entertainment during school is not the same as a student using a device after school once homework is done. A student using screens for structured learning is not the same as a student using screens for endless scrolling.
That is why the best family rule is not simply ‘less screen time.’ The better rule is ‘better screen time, with protected sleep and homework.’
Finding 4: Sleep May Be The Hidden School Lever
Sleep is one of the most important reasons to take screen habits seriously. A tired student can look careless, lazy, moody, or unmotivated. But sometimes the real issue is simple: the brain is running on too little rest.
In the 2024 NSCH data, 17.5% of school-age children with valid responses were reported to average under 8 hours of sleep in the past week. This number should be used carefully because a 6-year-old and a 17-year-old do not need the exact same amount of sleep.
The practical rule is simple: do not start with a full-day screen war. Start with bedtime. If entertainment screens move sleep later, the next school day pays the price. A one-hour no-entertainment-screen buffer before bed is often easier to enforce than a vague order to use your phone less.
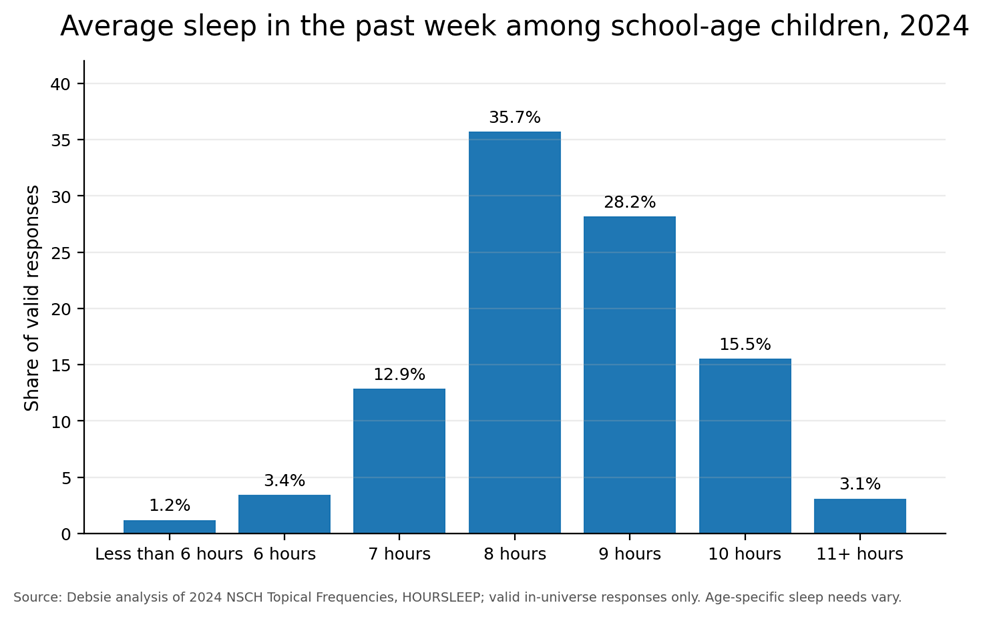
Figure 4. Average sleep in the past week among school-age children with valid responses. Source: Debsie analysis of 2024 NSCH Topical Frequencies, HOURSLEEP. Age-specific sleep needs vary.
Finding 5: Homework Is The First Routine To Protect
Homework is where screen habits become visible. A child may sit at the desk for 90 minutes, but if the child is checking messages, watching clips, switching tabs, or playing a game in the background, the real study time may be much shorter.
The 2024 NSCH homework table shows that 86.3% of school-age children with valid responses were reported to always or usually do all required homework. That is good news. It also gives families a practical target: protect the homework routine before it weakens.
The first rule can be small. Start with the first 30 minutes of homework as phone-free time. The phone stays outside the room. If the child needs a laptop for schoolwork, only the school task stays open. This is clear, measurable, and much less emotional than arguing about the whole day.
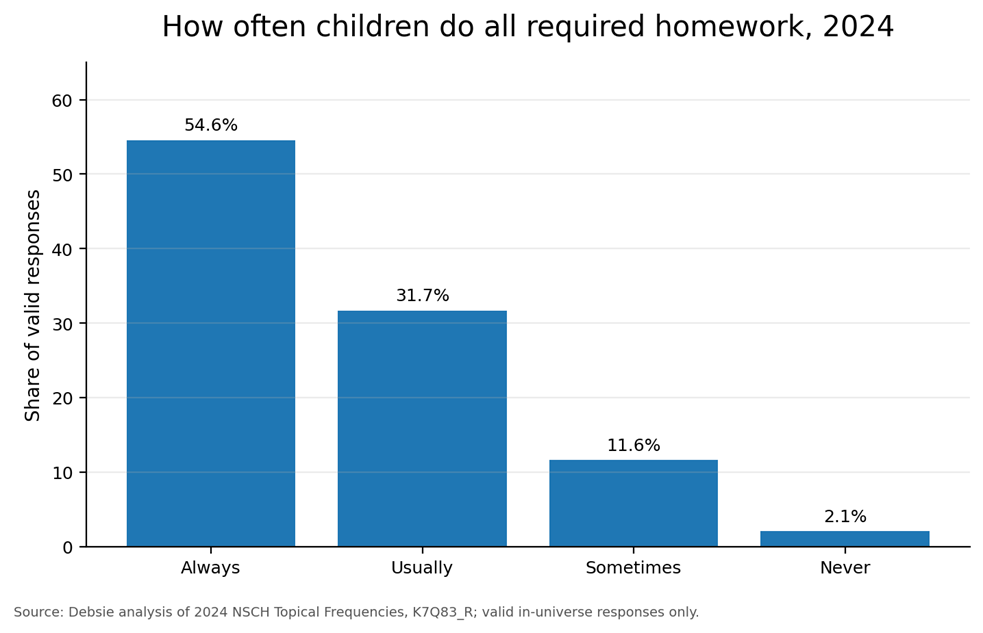
Figure 5. How often children do all required homework. Source: Debsie analysis of 2024 NSCH Topical Frequencies, K7Q83_R.
Finding 6: Motivation And Self-Control Are The Missing Middle
Grades do not fall only because of a screen. They often fall after small daily habits break down. The child starts later. The child sleeps later. The child rushes homework. The child stops reading. The child gets used to switching attention every few minutes.
That is why the NSCH school-behavior items are useful. Among valid school-age responses, 86.0% were reported to always or usually care about doing well in school. About 80.9% were reported to always or usually finish tasks they started. About 71.4% were reported to always or usually stay calm and in control when challenged.
These are learning anchors. If a student still cares, still finishes tasks, and still stays calm under challenge, parents have a strong base to work from. If screen habits begin to weaken those anchors, it is time to reset the routine before grades drop.
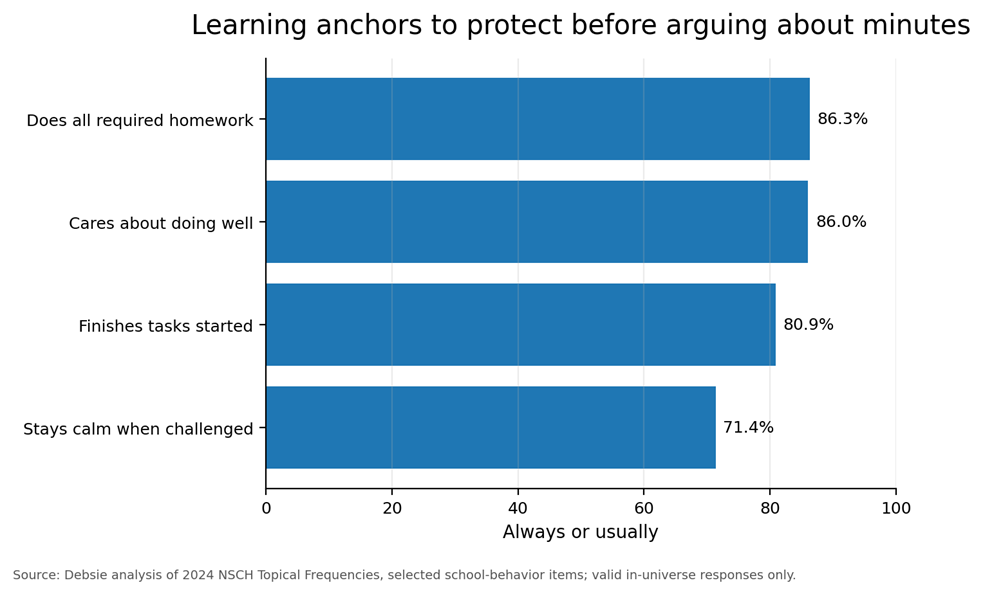
Figure 6. Learning anchors to protect before arguing about total minutes. Values show the share of valid school-age responses marked always or usually.
The Debsie Position: Pro-Learning, Not Anti-Screen
Debsie is not taking an anti-screen position. That would be too simple, and it would also miss the value of good learning technology. The stronger position is pro-learning.
Screens can help students learn chess, math, science, coding, languages, writing, and test skills. But screens can also pull students into passive entertainment, late-night scrolling, and broken focus. The difference is not the glass on the device. The difference is the purpose, timing, and routine around it.
A good family plan protects three things first: sleep, homework, and attention. After those are safe, parents can make calmer decisions about games, social media, videos, and entertainment apps.
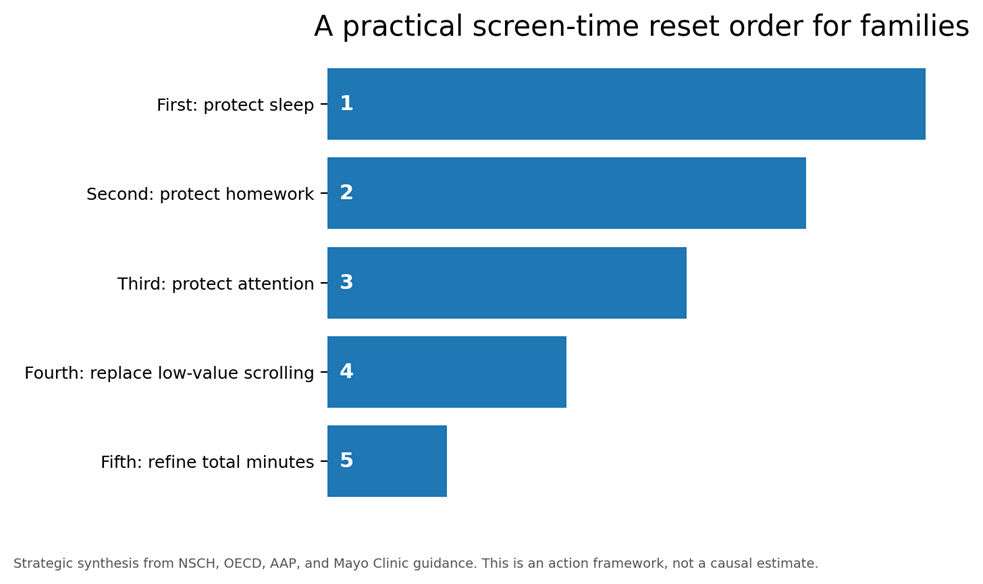
Figure 7. A practical order for screen-time changes. This is a family action framework, not a causal estimate.
The 14-Day Screen Reset For Families
This plan is designed to be simple enough to try this week. It does not need a new app. It does not need a lecture. It does not ask the family to become perfect. The aim is to protect the parts of the day that matter most for learning.
Days 1-2: Track the real pattern
For two days, do not change anything. Just track recreational screen use, bedtime, homework start time, and whether the phone was nearby during study. Do not count schoolwork, live tutoring, or structured learning as entertainment screen time.
Days 3-5: Make the first homework block phone-free
Protect the first 30 minutes of homework. This is often the highest-value part of the study session because the child still has the most energy. If the child needs a computer, keep only the school task open.
Days 6-8: Protect the last hour before sleep
Move entertainment screens out of the last hour before bed. Charge phones outside the bedroom if possible. Replace scrolling with reading, light review, drawing, stretching, family talk, or quiet music without a feed.
Days 9-11: Replace one low-value habit
Do not only remove. Replace. If one hour of scrolling disappears, add something real in its place: chess puzzles, a walk, music practice, sports, drawing, reading, cooking, or a short skill lesson.
Days 12-14: Review the change together
Ask what improved. Did homework finish faster? Was bedtime easier? Were mornings calmer? Did the child argue less? The goal is not a perfect rule. The goal is the smallest rule that clearly improves daily life.
A Better Family Rule Than A Daily Screen-Time Fight
A strict daily number may work for some families, but it often turns into a fight. The child argues about what counts. The parent becomes the screen police. The rule gets broken, and everyone feels like they failed.
A better rule is built around order. Schoolwork first. Sleep protected. Attention protected. Then entertainment screens can fit into the day. This gives parents a fair standard and gives children a path to earn freedom.
For example: first finish the highest-priority homework block without the phone. Then prepare the school bag, sports gear, or next-day materials. Then use entertainment screens inside a clear time window. This is not soft. It is structured.
What Parents Should Not Do
Do not turn every screen conversation into a punishment. Do not compare your child to another child. Do not ban learning tools because entertainment tools became a problem. Do not focus only on hours while ignoring bedtime and homework quality.
Also, do not expect one rule to work for every age. A 7-year-old needs more structure. A 17-year-old needs more ownership. But both need sleep, focus, and a clear routine.
The goal is not to make screens disappear. The goal is to stop screens from taking control of the parts of the day that build learning.
What Schools And Tutors Can Do
Schools and tutoring programs should stop treating screen habits as only a home issue. Students use screens for learning, so adults need to teach better screen habits as part of learning itself.
A tutor can ask the student to close extra tabs before a lesson starts. A teacher can explain why multitasking makes practice weaker. A learning platform can design lessons that are active and goal-based instead of turning education into endless scrolling.
This is where Debsie can stand apart. The best learning technology should not just add more screen time. It should turn screen time into focused learning time.
The Bottom Line
Screen time and grades are linked in public discussion, but the best answer is not a simple warning. The better answer is a routine.
Protect sleep. Protect homework. Protect attention. Then decide which screens help the child learn and which screens pull the child away from learning.
A child does not need a perfect digital life to do well in school. But the child does need boundaries that keep screens from taking over the parts of the day that matter most. That is the real lesson parents can use.
Methodology and Data Notes
Primary data source: 2024 National Survey of Children’s Health Topical Frequencies, released by the U.S. Census Bureau. The NSCH topical file includes records for 51,375 children according to Census documentation, and the frequency tables provide unweighted counts, weighted counts, and weighted percentages for each variable. [1][2]
Main screen-time variable: SCREENTIME. The question asks how much time the child usually spends on most weekdays with TV, computer, cellphone, or other electronic devices for programs, games, internet, or social media. The survey tells respondents not to include schoolwork. [3]
Academic variable: GRADES. This is parent-reported and applies to children in the relevant school-age universe whose schools provide letter grades. It is not a standardized test score and should not be described as one. [3]
Sleep variable: HOURSLEEP. This asks for average hours of sleep in the past week. Because the in-universe group includes a wide age range, this research article uses sleep as a routine signal rather than a single medical cutoff for every child. [3]
Homework and learning-anchor variables: K7Q83_R, K7Q82_R, K7Q84_R, and K7Q85_R. These are parent-reported behavior measures and should be read as practical routine indicators, not clinical measures.
Calculation rule: charts in the research article use weighted percentages normalized to valid responses unless the caption says otherwise. This means no-valid-response, not-in-universe, and logically skipped groups are removed where appropriate.
Original contribution: this article combines public NSCH frequency analysis, CAHMI/DRC trend queries, OECD PISA academic-performance reporting, and a family routine framework. The original value is not a new causal claim. It is the data-backed replacement lens: screen time becomes more risky when it replaces sleep, homework, attention, and active learning.
Data Table Used For The Main Charts
| Variable | Category | Weighted count | Calculated % | Calculation note |
| SCREENTIME | Less than 1 hour | 11,439,023 | 16.2% | Valid-response share |
| SCREENTIME | 1 hour | 11,087,396 | 15.7% | Valid-response share |
| SCREENTIME | 2 hours | 18,954,812 | 26.8% | Valid-response share |
| SCREENTIME | 3 hours | 12,827,560 | 18.1% | Valid-response share |
| SCREENTIME | 4+ hours | 16,506,784 | 23.3% | Valid-response share |
| GRADES | Mostly A’s | 16,341,660 | 37.2% | Valid letter-grade share |
| GRADES | Mostly A’s and B’s | 18,490,647 | 42.1% | Valid letter-grade share |
| GRADES | Mostly B’s and C’s | 6,546,690 | 14.9% | Valid letter-grade share |
| GRADES | Mostly C’s and D’s | 1,912,644 | 4.4% | Valid letter-grade share |
| GRADES | Mostly D’s or lower | 632,100 | 1.4% | Valid letter-grade share |
| HOURSLEEP | Less than 6 hours | 593,277 | 1.2% | Valid sleep-response share |
| HOURSLEEP | 6 hours | 1,705,483 | 3.4% | Valid sleep-response share |
| HOURSLEEP | 7 hours | 6,376,690 | 12.9% | Valid sleep-response share |
| HOURSLEEP | 8 hours | 17,679,412 | 35.7% | Valid sleep-response share |
| HOURSLEEP | 9 hours | 13,951,659 | 28.2% | Valid sleep-response share |
| HOURSLEEP | 10 hours | 7,698,464 | 15.5% | Valid sleep-response share |
| HOURSLEEP | 11+ hours | 1,531,951 | 3.1% | Valid sleep-response share |
| K7Q83_R | Always | 26,943,611 | 54.6% | Valid homework-response share |
| K7Q83_R | Usually | 15,656,967 | 31.7% | Valid homework-response share |
| K7Q83_R | Sometimes | 5,745,676 | 11.6% | Valid homework-response share |
| K7Q83_R | Never | 1,026,445 | 2.1% | Valid homework-response share |
| Learning anchors | Does all required homework | 86.3% | Always or usually | |
| Learning anchors | Cares about doing well | 86.0% | Always or usually | |
| Learning anchors | Finishes tasks started | 80.9% | Always or usually | |
| Learning anchors | Stays calm when challenged | 71.4% | Always or usually |
Sources
[1] U.S. Census Bureau. NSCH Datasets: 2024 Data Release.
[2] U.S. Census Bureau. 2024 NSCH Topical Frequencies PDF.
[3] U.S. Census Bureau. 2024 NSCH Topical Variable List PDF.
[4] Child and Adolescent Health Measurement Initiative. 2023-2024 NSCH Data Query: screen time.
[5] Child and Adolescent Health Measurement Initiative. 2022 NSCH Data Query: screen time.
[6] OECD. Finite Time to Learn and Play: Digital leisure time and students’ academic performance.
[8] American Academy of Pediatrics / HealthyChildren.org. Helping Kids Thrive in a Digital World.
[9] Mayo Clinic. Screen time and children: How to guide your child.
[10] CDC. 2023 Youth Risk Behavior Survey Results.

Adhip Ray is the founder of Debsie, an online learning platform focused on chess and skill-based learning for children. His work at Debsie brings together chess education, structured thinking, problem-solving, and interactive learning for young students.
Adhip has an academic background in law, statistics, analytics, and technology. He is from Amity Law School and the Indian Statistical Institute, Kolkata, with formal training that connects legal reasoning, data analytics, quantitative thinking, and structured problem-solving. This interdisciplinary background is reflected in Debsie’s focus on building sharper thinking skills in children through chess and related learning programs.
Adhip is also a FIDE-rated chess player from India. He holds FIDE ID 5055954 and has a standard FIDE rating of 1832. His FIDE profile records him as an Indian player with a long rating history in standard chess, including rated games from his competitive playing years. His chess background gives Debsie a founder-led connection to the game, not only as an educational activity but also as a competitive discipline that develops concentration, calculation, planning, and decision-making.
In addition to chess, Adhip has a strong interest in coding, data, and technical problem-solving.
Adhip’s profile combines chess, law, data analytics, and programming. At Debsie, this background supports the creation of learning experiences that are logical, structured, and skill-oriented. The platform’s chess-focused programs are connected to broader cognitive skills such as pattern recognition, patience, strategic planning, focus, and problem-solving.
As founder of Debsie, Adhip brings together experience from multiple fields: formal legal education from Amity Law School, analytical training from the Indian Statistical Institute, Kolkata, competitive chess experience through his FIDE-rated profile, and coding practice through LeetCode. This combination gives Debsie a distinct foundation in strategy, reasoning, analytics, and child-focused learning.
Through Debsie, Adhip is associated with building chess and learning content for children that goes beyond basic instruction. The platform connects chess with thinking skills, helping students approach challenges with more structure, clarity, and confidence. His own background in chess and analytical problem-solving gives the platform a direct link to the skills it aims to develop in young learners.
Adhip is also a member of Forbes Business Council.