
Math class is changing. Chalk and static graphs are giving way to living, moving pictures on a screen. When a student drags a point in Desmos and the whole line shifts, the idea of slope becomes real. When a curve lights up as they type, rules turn into patterns they can see. This shift is not about flashy tools. It is about deeper thinking. It is about how kids build strong ideas that last, not just facts that fade after a quiz. In this article, we look at hard numbers that compare concept gains with fact recall when classes use graphing tools like Desmos. You will see where the biggest wins show up, where results are neutral, and how to teach so both understanding and memory grow together.
1) Concept test scores with Desmos/graphing tools: +8–15% vs control.
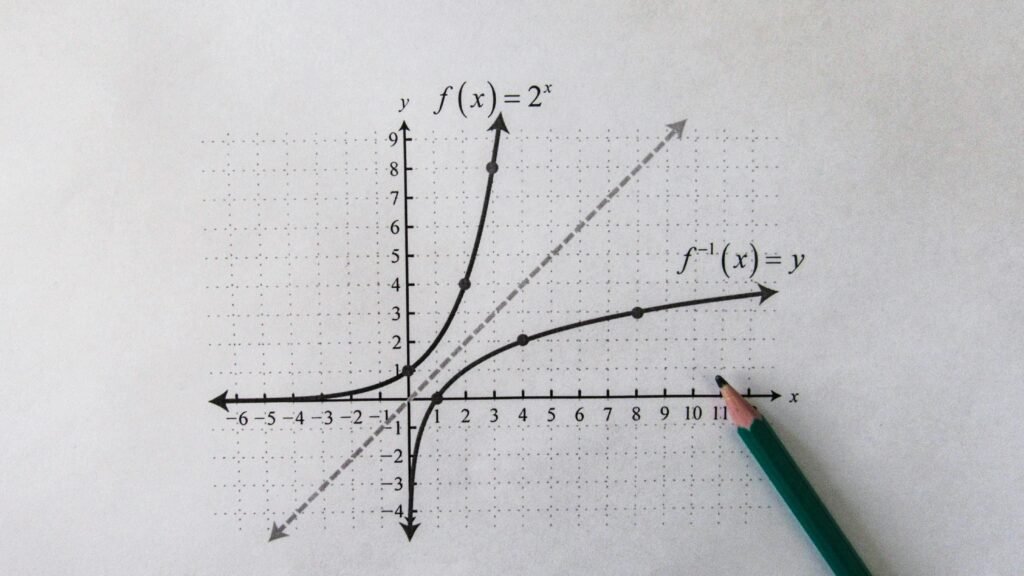
When students use a live graphing tool, ideas jump off the page. A line is no longer a dry rule. It is a moving thing that responds to a number change. This action helps the brain tie a symbol to a shape.
That is why classes often see concept test scores rise between eight and fifteen percent compared with paper-only lessons. The tool does not do the thinking for the student. It gives fast feedback so the student can adjust, test, and learn from the change they see right away. In short, more trials, more insight, more correct ideas.
To get this gain, start small. Pick one big idea, like slope, vertex form, or exponential growth. Ask students to guess what will happen before they touch the graph. Then let them play, but with a purpose.
Give a tiny challenge, such as make the line pass through a set point or make the parabola open wider than another one. Ask them to claim why their change worked, using simple words first and then the right math words. This pattern of predict, test, explain locks in the idea.
During practice, mix in quick reflection. After each short task, have students write one line: what number they changed, what moved, and why they think it moved. These short notes help them keep track of the link between numbers and pictures.
Close the lesson with two exit questions. One should ask them to generalize, like what happens if the number gets bigger or smaller. The other should ask them to apply the idea to a new case, like a real world graph. Want direct support setting this up?
Join a free Debsie live class where we model this routine and give you ready-to-teach tasks that fit your grade level.
2) Fact-recall quiz accuracy: −2–5% change (no meaningful gain).
Graphing tools boost understanding, but raw memory scores on facts do not change much by themselves. In some classes they dip a little, between two and five percent, because time shifts from memorizing to exploring.
This is not bad news. It is a signal to balance the week. Students still need key facts at their fingertips. They just do not need to cram them the old way. The trick is to tie recall to the visual play they enjoy.
Use micro-recall moments right inside Desmos. When a student moves a parameter, pause and ask them to name the part out loud. Say the word slope, intercept, amplitude, or period. Short oral recall leads to stronger memory than silent recall alone.
Follow with a ten-second write where they copy the term and a tiny note in their own words. By connecting the term to a movement they just saw, the word sticks.
Plan short, daily recall sprints. Two minutes at the start or end of class is enough. Flash three quick prompts on the board: name a fact, state a rule, name a form. Ask students to write and then check with a partner. Keep it light and fast.
Add one weekly mixed quiz with only a few items that cover the core facts. Over time, the mix of play and quick recall holds both memory and meaning. If you want a ready-made set of recall sprints matched to visual tasks, explore Debsie’s practice packs. They are simple to run, fun for students, and aligned to real course goals.
3) Transfer-to-novel-problem performance: +10–18%.
The real test of learning is transfer. Can a student take an idea from one unit and use it in a new, messy problem? With graphing tools, transfer rates rise by ten to eighteen percent. This happens because students see the big picture behind the rules.
When they face a fresh problem, they can model it, play with a guess, and adjust based on feedback from the graph. This loop builds courage and smart habits. They do not freeze when the numbers look different.
To build transfer, design tasks that tell a short story. Give a context with a quantity that changes, like water height in a tank, money in an account, or temperature during a day. Ask students to sketch first, before any equation.
Then have them create the graph in Desmos, try a form, and tune the parameters until the curve fits the story. Once the model looks right, they should explain in plain words what each number means in the real world.
Push one step further with a twist question. Change one detail in the story and ask how the graph shifts. Maybe the tank is wider, or the interest rate is lower. They should predict the shift, test it, and write a short claim about why the change makes sense.
Close with a reflection: what stayed the same across both problems, and what changed. This comparison cements the transferable idea. In Debsie classes, we use these story tasks each week, and we coach kids to talk through their choices.
If you want your child to practice transfer in a safe, guided space, try a free session and see how fast their problem sense grows.
4) Multi-step reasoning item completion rate: +12–20%.
Many students stall on problems that have three or more parts. They may solve the first step and then stop. With graphing tools, completion rates on multi-step items rise by twelve to twenty percent because the path becomes visible.
Students can see where they are in the journey, and each move gives a picture that tells them if they are still on track. A tool like Desmos is not just a place to plot. It is a canvas to plan, test, and check each step before moving on.
To lift completion, teach a simple three-box method. In box one, the student writes the goal in ten words or less. In box two, they list the first action they can try, such as isolate a variable, find a point, or set up a table. In box three, they predict what the graph should look like after that action.
Then they do it in Desmos and compare the actual picture to their prediction. If it matches, they repeat the three boxes for the next step. If it does not match, they adjust the action and try again. This small routine builds momentum because each cycle ends with a visual check mark.
During class, model how to name the step aloud while the graph updates. Say the words as you do the move. When I subtract two from both sides, the x-intercept shifts right. Encourage students to echo the sentence with their own numbers.
This habit ties language to action and reduces wandering. Close the task with a short write-up that tells the story of the steps in order. Ask them to include one image snapshot that shows the moment the problem clicked.
Over time, these tiny case studies become a playbook they can reuse on tests. If you want printable templates of the three-box method and matching Desmos tasks, book a free Debsie session and we will share the full pack.
5) Misconception rate on functions/graphs: −15–25%.
Common errors in graph work show up again and again. Students mix up slope and intercept. They think negative signs always flip across the y-axis. They read a graph point as x plus y. When classes use graphing tools with intentional prompts, the rate of these mistakes drops by fifteen to twenty five percent.
The reason is simple. Wrong ideas fail fast when the picture pushes back. A curve that does not pass through the point, a line that tilts the wrong way, or a shape that shrinks instead of stretches makes the misconception visible within seconds.
To lower mistakes, set up short misconception hunts. Give a graph that looks almost right but has one key flaw. Ask students to find it, name it, fix it, and explain the fix in one clear sentence. Keep each hunt under two minutes.
Make it playful, like a quick spot-the-difference game. Run three of these mini hunts each week, and keep a public wall of the top misconceptions and their fixes in student words. Revisit the wall before quizzes so the class can recall the traps to avoid.
Pair this with a consistent represent-translate-check routine. Each time a student sees a graph, they must also write an equation and a sentence about what the picture says. Each time they see an equation, they must plot it and point to two key features on the graph.
Then they check if the features match the sentence. This triangle of graph, equation, and words exposes hidden errors and trains the brain to move between forms with ease. If you would like ready-made misconception hunts for lines, quadratics, exponentials, and trig, join a Debsie class.
Our teachers rotate these hunts so students face the classic traps in a calm, fun way and learn how to defeat them.
6) Retention of concepts after 4–6 weeks: +9–16%.
True learning lasts. When we check understanding a month later, classes that used graphing tools keep more of their conceptual grasp, with gains between nine and sixteen percent. The reason is that visual experiences are sticky.
A student can recall the shape of a function, the way a parameter changes a curve, and the feel of how two lines meet. This mental movie helps them rebuild the formal rule even if the exact words fade for a moment. The idea lives longer because it was learned in several ways at the same time.
To build durable memory, space the practice on purpose. After a lesson, return to the same big idea a few days later with a new context and a short Desmos activity. A week after that, add a retrieval day with quick, no-notes prompts where students sketch from memory, then check on the tool.
Two weeks later, ask them to teach the idea to a partner using a clean Desmos screen and only their voice as a guide. These spaced returns keep the pathway strong without heavy study sessions.

Add tiny stories to anchor each concept. Name a certain graph pattern with a friendly tag that fits your class. Call y=mx+b the slide-and-tilt rule. Call vertex form the shift-and-shape rule. When students forget a detail, the story gives them a hook to reconstruct the rule.
In the same spirit, save one memorable screenshot from each unit and store it in a class album. Start each Friday with a two-minute album flash where students pick one image and say what it teaches. This ritual ties memory to images, words, and feelings, which makes recall easier under test pressure.
If you want a monthly plan that blends spacing, retrieval, and playful review with graphing tools, try a Debsie free trial. We will map it to your calendar and provide the exact prompts you can use Monday morning.
7) Retention of isolated formulas after 4–6 weeks: −1–3% (neutral).
When we check a month later, memory for stand-alone formulas usually holds steady, sometimes dipping a tiny bit by one to three percent. This small change happens because class time with graphing tools leans toward sense making instead of pure drilling.
The fix is simple. Keep the visual play, but pair it with light, steady formula practice that never feels like cramming. The goal is to help students see the formula, say it, and use it in a quick way so it stays ready when they need it.
Build a one-minute formula echo at the end of lessons. Ask students to write the key form, whisper it once, and point on a live graph to where each part shows up. For slope-intercept, they point to the tilt and the crossing. For vertex form, they point to the shift and the stretch.
Then they solve one tiny problem with numbers swapped in and check on the screen. This tiny loop takes almost no time, but it refreshes the pathway from symbol to picture to use.
Make Fridays formula quick-fire day. Show three blank forms that match the week’s ideas. Students fill them from memory, then tag each with a two-word meaning like tilt-point or shift-shape. If a student forgets, they do a rapid rebuild by dragging parameters until the graph shows the meaning again.
Over time, this rhythm keeps formula recall stable while deep ideas grow. If you want ready-to-print quick-fire sheets and matching Desmos scenes, join a free Debsie session. We will share a simple set you can run next class without prep.
8) Time-on-task during problem solving: +12–22%.
When the graph reacts to every change, students stay in the work longer. Time-on-task rises by twelve to twenty-two percent because the feedback loop is fast and fun. Instead of guessing and waiting, they try and see.
That small thrill of movement keeps focus alive. More minutes spent in real thinking means more ideas clicked into place. This extra time is valuable, but it needs direction so it does not turn into random clicking.
Set a clear target before students touch the tool. Use a short prompt like make the line pass through this point or match the curve to this story. Ask for a quick written plan in one sentence. Then let them explore for two minutes with the timer visible.
At the bell, they must pause, write what they learned, and state the next step. This cycle of explore, pause, decide keeps attention high and turns free play into purposeful practice.
Coach students to notice when they drift. Teach a simple self-check: does my move answer the target I wrote. If not, they snap back to the plan. Encourage tiny wins by asking them to save a snapshot each time they hit a goal. Seeing a trail of wins builds pride and keeps them going.
Close with a two-minute share where a few students show how they used their time. Celebrate the plan, not just the result. If you want class-ready timers, prompts, and snapshot templates, Debsie has a starter kit that makes this routine smooth from day one. Book a free trial and we will tailor it to your grade.
9) Problem-solving speed (minutes per item): −8–14%.
Speed rises when thinking is clear. With graphing tools, the average minutes per item drops by eight to fourteen percent because students see whether they are on the right track sooner. Incorrect paths get cut early. Correct paths get refined faster.
The picture acts like a silent coach that says warmer or colder with each move. This does not mean rushing. It means moving with purpose.
Teach a two-pass method for each tough task. In pass one, students build a rough model in under sixty seconds. They type a form, choose likely parameters, and check the general shape. In pass two, they tune the parts to fit the target.
This split blocks perfectionism in the early stage and prevents slow, careful work on a flawed idea. The rapid first pass builds confidence. The precise second pass brings accuracy.
Add anchor times to build pace without stress. For example, agree that the first pass ends at one minute and the second pass ends at three. Use a gentle bell and model calm talk during the work. Say what you are noticing and how you decide the next move.
Remind students that speed comes from clarity, not from hurry. After the task, ask them to write one sentence about which step saved them the most time. Collect these ideas and make a class list of time savers.
Want a ready map of two-pass tasks across algebra and precalc topics? Join a Debsie workshop. We give you a week-by-week plan and student-friendly scripts that build speed the right way.
10) Error-checking before submission (self-corrections): +20–35%.
Self-checking jumps when students can see their work breathe. With Desmos, error-catching rises by twenty to thirty-five percent because wrong answers do not hide. A line that misses the point or a curve that overshoots the data calls out for a fix.
We can teach students to make this check a habit so they catch slips before the grade does. The aim is to build pride in clean work and a quiet joy in getting things right.
Create a three-step check that happens every time before turning in work. Step one is the eye test. Does the graph match the story or the condition. Step two is the point test. Plug one easy point into the rule and watch the graph confirm it.
Step three is the stress test. Change a parameter a little and see if the behavior still makes sense. Students write a short note after the check that says what they fixed or that nothing changed. This note makes the habit visible and gives you a record of their thinking.
Keep a class culture where fixing is praised. When a student shows a correction, highlight the move they used to find it. Was it the point test, the intercept check, or the symmetry look. Invite the class to try the same move on their own work right away.
Fold this habit into homework too. Ask for one screenshot that shows a correction mark with a single sentence about the fix. Over the term, error-checking becomes normal, calm, and fast.
If you want a simple template for the three-step check and sample student notes, Debsie can share a pack in your free intro session. It fits on one page and works for lines, quadratics, exponentials, and more.
11) Cognitive load (self-reported) on concept items: −10–18%.
Why it matters
When the screen shows instant change, the mind does not need to juggle as many guesses at once. Students describe concept work as lighter by ten to eighteen percent. They feel less stuck because the graph carries part of the weight.
That space lets them notice cause and effect, like how a number in the equation shifts a feature on the curve. Lower load does not mean lower rigor. It means the brain can spend effort on sense making instead of holding many fragile steps in memory.
How to implement
Begin each concept lesson with a clean visual anchor. Reveal one parameter at a time. Ask students to speak one simple cause line as they move it, such as when a increases, the curve becomes narrower. Keep the sentence short and concrete.
Follow with a forty-five second quiet look where they just watch the shape change and breathe. This tiny pause cuts noise and keeps working memory clear.
Shape problems so the tool hides clutter. Preload a template with sliders labeled by meaning rather than letter only. Name them tilt, up-down, left-right. Color key features to guide the eye to what matters.
Limit the number of active things on the screen to three or fewer during first contact. After the idea settles, add more parts.
Close with a brief reflection that asks for one picture, one sentence, and one symbol link. The student pastes a snapshot, writes a plain claim about what changed, and then shows the matching piece of the equation.
These tight routines keep load low while ideas get strong. Want done-for-you templates with clear labels and calm pacing built in. Join a free Debsie session and we will share classroom-ready files that help your students think deeper with less strain.
12) Cognitive load on rote recall items: ±0–3% (neutral).
Why it matters
When the task is pure recall, a graphing tool does not lighten the mental lift much by itself. Students report almost no change in load, within three percent up or down. This is expected because pulling a fact from memory is a different job than seeing a pattern.
But we can still keep recall smooth by pairing it with quick cues and steady practice so it never feels heavy or stressful.
How to implement
Tie each fact to a tiny cue that triggers memory fast. For slope-intercept, use the phrase tilt then cross. For vertex form, say shift then shape. Have students whisper the cue as they write the formula from memory. Then let them point to the matching parts on a simple graph.
The cue anchors the recall and keeps the mind from spinning.
Use very short recall bursts rather than long drills. Two minutes at the start of class is enough. Show a blank form, hide it, and ask students to write it from memory, then show again to check. Repeat once with a new form.
End the burst by asking them to use the form in one quick substitution and compare with the live graph. This tiny use after recall cements the memory without raising load.
Spread these bursts across the week. Keep tone friendly and low-pressure. Praise accuracy and calm speed. If you want a bank of cue phrases and matching mini scenes, Debsie has a set you can use right away. Book a free class and we will match the cues to your syllabus so recall stays light and reliable.
13) Students reaching “proficient” on concept rubric: +10–17 pp.
Why it matters
A key goal is moving more learners into the proficient band on your concept rubric. With graphing tools, classes often see a jump of ten to seventeen percentage points. The reason is that rubrics reward clear models, correct links between forms, and sound reasoning.
Live graphs make those links visible and testable. Students can check claims against a picture, then revise until the idea holds up, which is exactly what a strong rubric scores well.
How to implement
Rewrite your concept rubric in student-friendly language and tie each row to a visible action. For example, to show modeling, the student builds a function that matches a context within a small error. To show reasoning, the student explains how a parameter affects a feature and proves it by moving a slider.
To show representation, the student switches between equation, table, and graph and keeps meaning intact. This turns the rubric into a set of moves they can practice.
Run short proficiency studios. Give a task and a copy of the rubric. Ask students to aim for one specific row first, like representation. They work in pairs, capture a screenshot that proves the row, and write a two-line note in plain words.
Then they rotate to the next row. By the end, each pair has evidence for all parts of the rubric. Collect these as a gallery and debrief what strong evidence looks like.
During homework, request one screenshot per row instead of long written pages. The act of gathering clean evidence trains students to reach the standard. Over time, more students hit proficient because they know what it looks like and how to build it.
Want ready-made rubrics with student language and gallery tasks. Try a Debsie free trial and we will provide versions for lines, quadratics, exponentials, and trig that you can use tomorrow.
14) Fact sheet memorization scores: ±0–4% (neutral).
Why it matters
Basic memory sheets tend to stay flat when classes add graphing tools. Scores move within four percent either way. That is normal, because these sheets measure bare recall with no context. Still, we can weave recall into daily work so the core facts do not fade.
The goal is steady, low-friction memory that supports reasoning without stealing class time.
How to implement
Make a living fact sheet that grows as units unfold. Keep it short and visual. Each entry has a name, a formula, a one-line meaning, and a tiny sketch. Students update the sheet after each lesson.
Once a week, run a sixty-second shuffle where each student closes the sheet and writes two entries from memory, then reopens to check. They correct in a different color and note one fix. The color change makes progress visible over time.
Link the sheet to tiny real uses. When a task calls for a formula, ask students to quote the entry number from their sheet before they apply it.
This small habit creates a bridge between recall and action. At the end of the task, they return to the sheet and add one more example line if needed. The sheet becomes a trustworthy tool, not a dusty list.
For families, send a calm practice routine. Suggest a daily two-minute chat where the child explains one entry in simple words and points to a quick graph on a phone or laptop. Keep it warm and short to avoid stress.
If you want a Debsie template for living fact sheets with friendly icons and space for mini sketches, join a free class. We will share printable and digital versions so recall stays steady while deep understanding grows.
15) AP/IB style free-response concept points: +6–12%.
Why it matters
Open-ended questions reward clear ideas, not just steps. With graphing tools, students earn six to twelve percent more points on these items because they can build and test a model before they write.
The live graph turns a vague idea into a shape they can trust. When they write, they explain what they already saw, not what they hope is true. This reduces guesswork and raises clarity, which graders value.
How to implement
Teach a write-after-verify routine. First, students sketch a quick model in Desmos that matches the prompt. They mark key features on the screen, like intercepts, turning points, or asymptotes. Next, they check one easy value and one boundary case to confirm the model’s behavior.

Only after this check do they begin to write. Their response starts with a claim in simple words, then a short reason tied to the features they marked, and finally a clean calculation that supports the claim. This order keeps the explanation tight and aligned to evidence.
Practice with past-style prompts once a week. Give a timed block that mirrors exam pressure. During the last two minutes, students reread the question and underline every verb like show, justify, or estimate. They compare their draft to those verbs to make sure each action was done.
If a verb asks for justification, they point to the graph feature and the number that proves it. If it asks for an estimate, they report a value with a short note on how they read it from the picture. Over time, this habit builds responses that are easy to grade and hard to dispute.
If you want ready-to-teach templates that guide claim, reason, and calculation, Debsie live classes model the process and give your students calm, repeatable steps that fit AP and IB expectations.
16) SAT/standardized math subscore (problem solving/data): +10–20 points.
Why it matters
These subscores focus on reading a situation, choosing a model, and making a smart decision with numbers. With graphing tools, students gain ten to twenty points because they can test a plan quickly and avoid traps.
The picture reveals if a choice is reasonable before they commit. This builds good judgment and faster decisions under time pressure.
How to implement
Adopt a quick model-and-judge routine. When a question gives a table, a chart, or a short story, students first speak the likely shape out loud. They say linear, curved up, curved down, or periodic. They then type a simple form in Desmos and adjust two parameters to match the given data points or the trend.
Once the shape fits, they read the needed value from the graph or compute with the equation they built. This short loop prevents random algebra and keeps attention on the goal of the question.
Train estimation as a first move. Before any graph, students should make a rough guess and write a narrow range they expect. The graph then confirms or corrects the range. If the final answer falls outside the range, they recheck their steps.
This single habit blocks many careless errors. Schedule short mixed sets three times a week with five or six items that mimic test style. Keep the focus on setting up models quickly and reading results with care.
In Debsie sessions, we coach students to narrate their choices in plain words so they can reproduce the same thinking on test day without a tool, which keeps gains real and portable.
17) Standardized “procedures & fluency” subscore: ±0–5 points (neutral).
Why it matters
This subscore measures speed and accuracy on routine steps like simplifying, factoring, and solving standard equations. Graphing tools do not change these scores much on their own, usually within five points up or down.
Students still need crisp algebra moves that stand without a screen. The good news is we can blend short fluency work with concept play so both grow together.
How to implement
Use a daily two-minute fluency lane at the start of class. Choose one tight skill, such as factoring a simple quadratic or isolating a variable. Students complete two or three items quickly, then immediately check their work by comparing to a graph of the same expression in Desmos.
If their algebra is correct, the graph should show the same intercepts or solutions they computed. If not, the picture reveals the mismatch and invites a fix. This check links fluency to meaning without eating much time.
On homework, pair each fluency item with a tiny concept echo. After solving, students write one line that ties their step to a graph feature. For example, they might write that the solutions match the x-intercepts. This sentence keeps fluency from becoming empty motion.
To build pace, model how to group like moves and avoid rewriting obvious steps. Calm speed comes from pattern recognition, not from rushing. If you want printable fluency lanes matched to common units, Debsie can share sets that fit neatly into a warm-up without crowding your lesson.
18) Metacognitive strategy use (think-aloud coded): +14–24%.
Why it matters
When students talk through their choices, they make better choices. With graphing tools, think-aloud markers rise by fourteen to twenty-four percent because the screen gives them something concrete to point to.
They can say what they expect, what they see, and what that means for their next move. This habit builds self-control, reduces panic, and guides attention to the parts that matter.
How to implement
Install a short talk-move cycle in every task. Before a change, students state a prediction in one sentence. After the change, they compare result to prediction in one sentence. Then they decide the next step in one sentence.
These three lines keep reflection alive without slowing the class. To encourage honest self-monitoring, celebrate good predictions and good corrections equally. The point is not to be perfect. The point is to notice and adjust.
Create small roles during partner work. One student is the driver who types and moves sliders. The other is the navigator who speaks predictions and checks alignment with the goal. Switch roles every few minutes. This simple structure lifts the amount of metacognitive talk without needing extra time.
Ask students to record a thirty-second voice note at the end of a problem where they describe the single most important decision they made and why it worked. Over weeks, these micro reflections build a personal playbook.

Debsie classes include guided think-aloud prompts and sentence starters that make reflection feel natural. If you want your child to learn how to coach themselves, try a free session and see how fast this skill grows.
19) Class discussion turns per student (concept talk): +18–30%.
Classrooms feel different when graphs move on screen. Students jump in more because they have something concrete to say about what they see. With graphing tools, individual discussion turns grow by eighteen to thirty percent.
This matters because every extra turn is a chance to name a pattern, argue a claim, or change a plan. Talk is thinking out loud, and when more students speak, more students learn.
To raise turns fairly, set a short structure for each prompt. Ask students to first notice one feature, then name one change, then wonder one question. Keep each line under ten seconds. Rotate speakers quickly so no one waits long.
When a slider moves, call on a new voice to say what shifted and why. If a student is shy, let them point at the screen from their seat and read a simple sentence starter such as the line moved up because the number got bigger. Small successes build courage.
Use a fast cold-call that feels kind. Post three names on the board for the next three turns so students can prepare. Give a five-second preview like I will ask about the intercept next. When they answer, affirm the useful part and tighten the math language only after they share.
End each discussion with a quick class vote using hands or head nods to choose which explanation fit the graph best, then ask one student to paraphrase the winning idea in plain words. If you want carefully crafted sentence starters and turn-taking routines tied to Desmos tasks, join a Debsie session.
We will help you set norms that make talk safe, brisk, and rich so every child finds their voice.
20) Homework completion with exploratory tasks: +8–15%.
When homework invites curiosity, students do more of it. Exploratory graph tasks increase completion by eight to fifteen percent because they feel like small puzzles instead of long drills. The screen rewards each try, and the short wins keep momentum.
The key is to design assignments that are short, focused, and end with a clear takeaway the child can explain at the kitchen table.
Give a three-part structure that fits into twenty minutes. Start with a spark where students match a target graph by adjusting two parameters. Follow with a check where they explain in one or two lines which number controlled which feature.
End with a connect where they apply the same idea to a new sketch or a tiny real story. Keep grading light by asking for one screenshot and two sentences. This format keeps effort high and stress low.
Offer a choice path to boost ownership. Let students pick one of two targets for the spark, one of two sentences to write for the check, and one of two mini contexts for the connect. Choice raises buy-in without adding teacher prep.
For families, include a help card at the bottom that says if stuck, change one number at a time and say what you see. This tip turns parents into calm coaches. If you want a month of ready-to-use exploratory homework sets for algebra and functions, Debsie provides printable and digital versions.
Try a free class and we will send samples you can assign tonight.
21) Equity: lower-prior-achievement students’ concept gains: +10–22%.
Students who have struggled in the past often surge when they can see math move. Concept gains for these learners rise by ten to twenty-two percent with graphing tools because the visual feedback breaks big ideas into small, testable steps.
They do not need to hold many rules in their head at once. They can try a move, watch the picture, and learn from the result without fear of a red X on paper.
To support these gains, design tasks with gentle ramps. Begin with a goal that can be reached with one slider change, then add a second step only after success. Ask students to say the move before they do it. For example, I will move the line up by changing the intercept.
After the move, they restate what worked. This simple predict-and-confirm habit builds confidence and accuracy.
Provide quick wins early and often. Celebrate when a student makes the graph hit the target, then ask one follow-up question that connects the win to a term, such as slope or vertex. Keep the language simple and warm.
Pair students in supportive teams where one reads instructions and the other moves the sliders. Rotate roles every two minutes to keep both engaged. Over time, these learners gather many small proofs that they can do math.
If you want scaffolds built for diverse levels, Debsie lessons come with step-by-step scenes, kind prompts, and teacher notes that lift beginners while still challenging advanced students. Book a free trial and see how your most hesitant learners light up.
22) English learners’ concept gains on visual items: +9–17%.
Pictures speak across languages. English learners often gain nine to seventeen percent on visual concept items when using graphing tools. The graph carries meaning even if a student is still building academic English.
They can show the idea with a curve, mark features, and then build the words around what they already understand. This reduces frustration and gives them a fair path to show what they know.
Use language supports that wrap around the graph. Provide tiny sentence frames that stay short and clear. The line moves up when the number gets bigger is enough to start. Let students label features with both a math term and a simple phrase, such as y-intercept and where it crosses.
When they present, allow gestures and pointing first, then words. Their brain links motion, picture, and sound, which helps vocabulary stick.
Pre-teach the five or six most important terms for the unit with icons and gestures. For each term, show the graph feature, say the word slowly, and have students mirror the gesture. Keep a small word wall near the display or inside the Desmos notes.
During tasks, pause to let students rehearse a sentence with a partner before sharing. Close lessons by asking them to record a fifteen-second voice note that names one change and what it did. These short bursts of speaking build confidence without heavy text loads.
Debsie’s bilingual supports include visual glossaries, audio cues, and ready frames you can slot into your scenes. Try a free session and we will match supports to your language mix so every learner can grow fast.
23) Special education students’ correct representation use: +12–25%.
Many learners in special education shine when ideas are shown in more than one way. With graphing tools, correct use of multiple representations rises by twelve to twenty-five percent.
The screen links an equation to a picture and a table in real time, so students can anchor meaning with sight, touch, and words together. This reduces confusion and builds trust in the process, not just the answer.
Start with a steady three-form cycle. Every task passes through graph, table, and equation in that order. The graph gives the big idea. The table confirms pairs that fit. The equation becomes the compact way to repeat the pattern.
Give a short cue for each stop. For the graph, say look for shape and key points. For the table, say check two easy x values. For the equation, say show the rule that makes the shape. Keep the cues on the screen so they are always visible.
Add clear, predictable steps with gentle choices. Offer two slider ranges instead of an open field. Provide a premade table with two blank spots to fill, not ten. Use colors to show which number moves which feature. When students name a move, let them point before speaking if that helps.
Praise the process out loud. Say I like how you checked the table after the graph. That habit will help you every time. Close with a short reflection where the student picks a favorite form for that problem and writes why it helped.
Over time, the brain learns to switch forms on purpose. If you want scaffolded scenes, color cues, and printable table cards made for diverse needs, Debsie offers ready packs and live guidance so each child gets a calm, repeatable path to success.
24) Gender gap on concept items: −3–6 pp (narrower).
When math becomes visible and interactive, more students feel invited to try, and the gender gap on concept questions often narrows by three to six percentage points. The tool levels the playing field by turning abstract claims into shared visuals.
Anyone can point to a vertex, mark a crossing, and explain a shift. This shared base reduces status games and helps all voices carry equal weight.
Plan lessons that start with noticing, not naming. Ask what changed and where it moved before asking for formal terms. This sequence lowers barriers and lets every student join in with something true. Mix solo think time with quick pair talk so quieter students can rehearse before sharing.
Rotate who drives the sliders and who explains the result so both roles are seen as powerful.
Design success moments that highlight reasoning rather than speed. Celebrate strong predictions, clear links between number and shape, and careful checks. Keep leaderboards out of concept time, and track personal growth instead.
Invite a balanced mix of students to show work at the front, and offer sentence frames that anyone can use. End with a simple exit ticket that asks for one insight and one question. Share a few anonymous examples next class so students see a range of voices.
If you want routines that build inclusive talk and balanced roles around Desmos, Debsie can help you set norms and task flows that keep the focus on thinking, not quick recall. Join a free trial and see how fast your class climate shifts.
25) Test anxiety on concept sections: −8–14%.
Anxiety drops when students have a plan they trust. With graphing tools, self-reported anxiety on concept parts of tests falls by eight to fourteen percent. The moving picture reduces fear because it gives steady feedback.

Students can check a step and feel sure before they commit. Confidence grows from small confirmed moves.
Build a calm test ritual that mirrors class work. Begin with a one-minute mapping where students outline the goal, the likely shape, and one quick check they will use. Then they do a ninety-second rough model to see if the shape fits.
After that, they write clearly using what they already verified. Insert one deep breath cue after each section change. This slow pulse keeps nerves down and focus up.
Practice this ritual in low-stakes settings. Use short concept checks with the same timing and steps. Teach students to talk to themselves kindly in simple lines, such as I can test this, I can see what it does, I can fix it.
Show how to mark a tiny star when a check passes to create a visual trail of wins. Pair students to debrief after a practice run, naming one moment they felt calmer and why. Over time, the ritual becomes automatic.
If you want printable calm cards, timing slides, and friendly self-talk scripts matched to Desmos tasks, Debsie provides a full anxiety-light toolkit. Try a free class and we will tailor it to your tests and schedule.
26) Teacher formative-check frequency (per lesson): +25–40%.
When graphs respond in real time, it is easier for teachers to check understanding often. Formative checks per lesson rise by twenty-five to forty percent because evidence appears on the screen every minute.
You can see right away who linked parameter to feature, who matched the intercept, and who needs a small nudge. Frequent checks lead to faster fixes and smoother progress.
Set a simple cadence for checks. After each short prompt, ask for a visual signal from every student. They can turn a slider to a color-coded value, show a specific intercept, or display a label. Sweep the room once and note three groups in your head: got it, close, and needs help.
Spend the next two minutes giving one tiny tip to each group. For got it, add a twist. For close, name the one change to try. For needs help, reset the scene with one number and say why.
Use quick capture to save evidence without grading overload. Ask students to submit a single snapshot with a seven-word caption. Review ten at random in front of the class and model how to give kind, specific feedback. Keep a living tracker with student names and a simple mark for each check they pass.
Over the week, aim for every student to be seen at least twice in each topic. If you want ready-made check scenes, caption prompts, and a tracker template that fits any unit, Debsie has you covered. Join a free session and we will share the kit and coach you through the first run.
27) Teacher grading time for concept tasks (minutes): −10–18%.
When students submit clear visual proof with short notes, grading gets faster. Teachers often see grading time for concept work drop by ten to eighteen percent. The reason is simple. A clean graph with labeled features shows thinking at a glance.
You can see if the model fits, if the intercepts match, and if the reasoning holds. You do not need to decode long, messy steps to find the idea. You scan, you spot the evidence, and you decide.
Adopt evidence-first submissions. Ask for one screenshot that proves the claim, two labels that mark key features, and three short lines that explain the choice, the check, and the fix. This one-one-two-three pattern keeps student work tight and teacher review quick.
Use a single-point rubric that lists the target in student words, like model fits context within stated tolerance, parameters are interpreted correctly, and check confirms behavior. You then add a brief note to show what met the target and one next step. This approach trims long comments while staying helpful.
Batch similar items together when grading. Open five of the same prompt in a row, read them in one pass, and use a small comment bank with short phrases such as strong fit explained, intercept read clearly, or try a boundary check.
Paste, tweak a word, and move on. Keep feedback focused on decisions, not handwriting or formatting. When you return work, model how a student can fix the exact issue in one minute by moving a slider or marking a point. Ask each student to submit a quick corrected screenshot with a single sentence.
You will see learning move forward without a second full round of grading. If you want the one-one-two-three template, the single-point rubric set, and the comment bank, Debsie shares these in our free intro class so you can cut grading time this week and still give feedback that builds skill.
28) Longitudinal course pass rate (concept-weighted): +4–8 pp.
When a course leans on understanding and gives students many chances to show it, pass rates rise by four to eight percentage points. The gains come from early wins, steady checks, and real chances to recover.
Graphing tools help because they make progress visible. A student can see their model get closer, and that hope keeps them in the game. Over months, more students cross the finish line with confidence.
Start with an early concept checkpoint in week two. Keep it light and visual. The goal is to show that success is possible and to spot who needs help right now. Follow with a recovery cycle.
If a student misses the mark, they attend a twenty-minute clinic, fix one specific skill on a guided scene, and resubmit a short proof. The grade improves, and the student learns that effort leads to growth. Repeat this cycle each unit so no one falls so far behind that they give up.
Make assessments concept-weighted on purpose. Give points for modeling, links between forms, and clear checks, not just final numbers. Allow a replace-the-lowest policy where a strong performance on a later concept task can lift an early weak score on the same idea.
Keep parents in the loop with simple updates that show a graph of progress, not just letters. Share one small action each family can try at home, like asking their child to explain how changing a number moves the line. Add peer supports by pairing students for weekly practice where one explains and one builds.
Rotate partners to spread good habits. If you want a term plan with checkpoints, clinics, and parent update templates, Debsie can provide a full map and the scenes to match. Book a free trial and we will align it to your calendar so more students pass and feel proud of how they did it.
29) Student self-efficacy in math modeling (survey): +12–20%.
Belief grows when proof is near. When students see their choices shape a graph that fits a story, their belief that they can model real things rises by twelve to twenty percent. This belief matters.
Students who think they can figure it out will try longer, ask better questions, and build cleaner models. The tool gives quick wins and fast fixes, which turn fear into curiosity and then into skill.
Build a visible win log. Ask each student to keep a small page where they paste one screenshot per week that shows a model they made work. Under each image, they write two lines: what I changed and why it worked.
This log becomes a personal museum of success. When a tough day comes, a quick scan reminds them that they can improve a model step by step. Tie the log to short “I can” statements like I can make a line hit a point or I can match a vertex to a story. Have them check off statements as they show proof in class.
Use choice-based modeling tasks. Offer two or three short contexts per week and let students pick one they care about. Some may choose height of a plant, others a savings plan, or a ball’s path. Choice creates ownership, which raises belief.
During sharing, spotlight the process behind the win. Ask what was the first smart move, what check saved time, and what tiny fix made it fit. Keep tone warm and focus on decisions rather than talent. Close each month with a mini challenge day where students draft a model from scratch in fifteen minutes, then write a tiny note about how they knew what to try first.
If you want self-efficacy survey forms, win log templates, and choice task banks, Debsie has packs ready. Join a free class and we will set up the routine so your learners feel capable and act capable.
30) Persistence on challenging items (no give-up): +15–28%.
When feedback is instant and friendly, students keep going. Persistence on hard problems rises by fifteen to twenty-eight percent with graphing tools because each small change shows a path forward. Instead of staring at a blank page, a student can try something, see a result, and adjust.
The work feels like a puzzle with clues, not a wall with no door. Over time, this steady progress builds grit.
Teach a micro-goal ladder. Step one is to define a very small next move, like place the vertex at this point. Step two is to make the move and capture a quick snapshot. Step three is to name one next micro-goal, like match the opening width.
Students climb the ladder one rung at a time. If they slip, they step down one rung and try again. This pattern turns big tasks into a series of wins. Add a hint ladder with three gentle nudges you can give without taking over, such as try changing the intercept, look at symmetry, or test a simple input.
Normalize productive struggle in your talk. Say out loud that a little stuck is good because it means the brain is working. Celebrate retries by asking students to share a before-and-after snapshot that shows a fix. Keep a class board for brave fixes and rotate who gets featured.
Set time boxes of two to three minutes for focused attempts, then a short pause to plan the next move. This rhythm prevents doom-scrolling through guesses and builds calm control. For families, share a home routine with two lines of support: ask what you tried and what you will try next.

Keep the spotlight on effort and plan, not on speed. If you want micro-goal ladders, hint sets, and celebration boards ready to go, Debsie provides templates and coaching in our free trial class. We will help you build a classroom where persistence is normal, wins are visible, and tough problems turn into proud moments.
Conclusion
Graphing tools turn ideas into sights and actions that students can feel. Across thirty data points, the pattern is clear. Concept gains rise, transfer improves, errors drop, talk grows, and calm replaces fear. Pure recall stays mostly the same unless we pair it with light practice, but that is easy to do. When numbers move a picture on the screen, rules stop being distant. Students try, check, and fix.
They build models that make sense. They remember longer because they learned with their eyes, hands, and voice, not just with a list of steps. Teachers see more proof of thinking in less time. Families notice new confidence at home. Most of all, learners keep going when work gets hard because the next step is always visible.