
Parents and teachers want the same thing. We want children who can think clearly, solve hard problems, and feel confident with numbers. But not all math programs build these skills in the same way. Some give many quick drills. Others slow down and go deep. One well known approach is the Singapore method, often called CPA for Concrete, Pictorial, Abstract. It moves from hands-on objects, to clear pictures, to symbols and equations. This careful path helps children understand why math works, not just how to do steps. In this article, we compare CPA-style curricula with more common non-CPA programs by using clear, easy-to-read data points. Each section will show one simple stat, then turn that stat into plain, useful actions you can use right away at home or in your classroom.
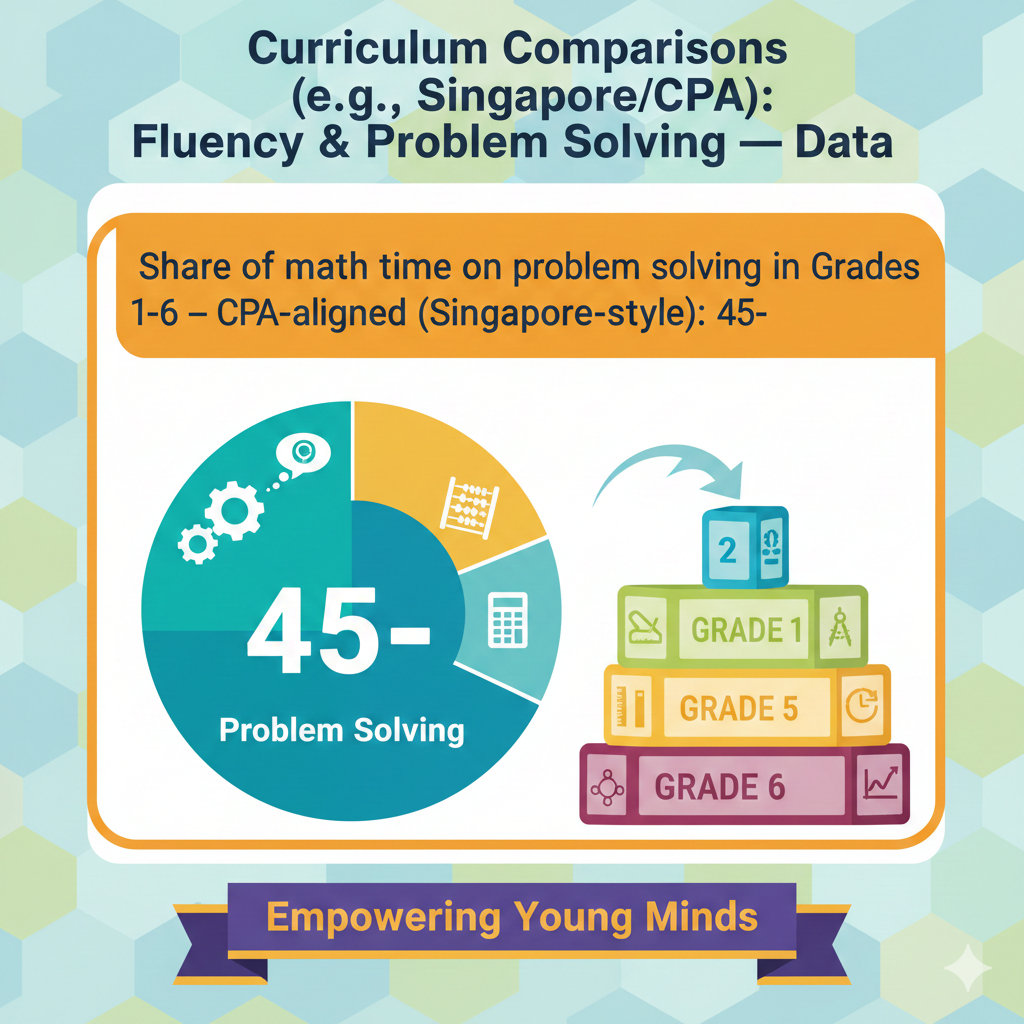
1) Share of math time on problem solving in Grades 1–6 — CPA-aligned (Singapore-style): 45–60% of lesson minutes; non-CPA programs: 20–35%
What this means
In a CPA-style class, almost half the lesson is used for solving real problems, not just copying steps. Students work through number stories, puzzles, and tasks that make them think. They try different paths, test ideas, and explain choices.
In many non-CPA programs, less time goes to this kind of deep practice. Students often do short, simple items that match a rule they were just shown. The gap matters because the mind grows stronger when it wrestles with rich problems.
How to act
Plan every lesson so at least half the minutes go to true problem solving. Start with a short launch that sets a goal in simple words. Use a single, well chosen task that can be solved in more than one way. Protect quiet time for students to think alone before they talk.
Invite them to draw a model if they feel stuck. Ask them to compare two methods and say which is more efficient and why. If you teach young grades, give blocks or counters first, then pictures, then symbols. If you teach upper grades, open with a word problem that needs two or three steps and has numbers that fit friendly models.
At home, set a ten minute problem time after homework. Choose one good word problem. Let your child explain their plan out loud. Praise the plan even if the answer is not yet right. In a week, track the share of minutes used for problem solving.
Aim for a steady rise toward the forty five to sixty percent range. Over time, you will see fewer blank stares and more brave starts.
2) Number of worked examples per new concept — CPA: 3–5 high-quality, step-by-step examples; non-CPA: 1–2 shorter examples
What this means
Students do not learn best from one quick example. They need a small set of rich examples that show the idea from different angles. In CPA lessons, each example is chosen to spotlight a key move. One may show a direct model. One may show a common mistake.
One may switch the numbers to test if the method still works. The examples walk from concrete to pictorial to abstract. In many non-CPA lessons, there are only one or two examples before students are sent off to practice. That can lead to guesswork.
Students try to copy a pattern that they do not understand, and errors harden into habits.
How to act
Build a tight set of three to five examples for every new idea. Keep them short, but make each one earn its place. Start with a hands-on model or a story. Move to a drawing or bar model. End with a clean equation. Say what is the same and what is new each time.
Ask a why question after each example. Have students turn and explain the step in their own words. Include one example that tempts a classic error, like adding across a proportion or lining up digits wrong. Let the class spot and fix it. If you teach at home, make a quick mini booklet.
Put one example per page with space to draw. Have your child fill the space under each example with their own model and a one sentence reason. Save the booklet and review it the next day before practice. Over a month, this pattern will raise clarity, reduce reteaching, and make independent work smoother.
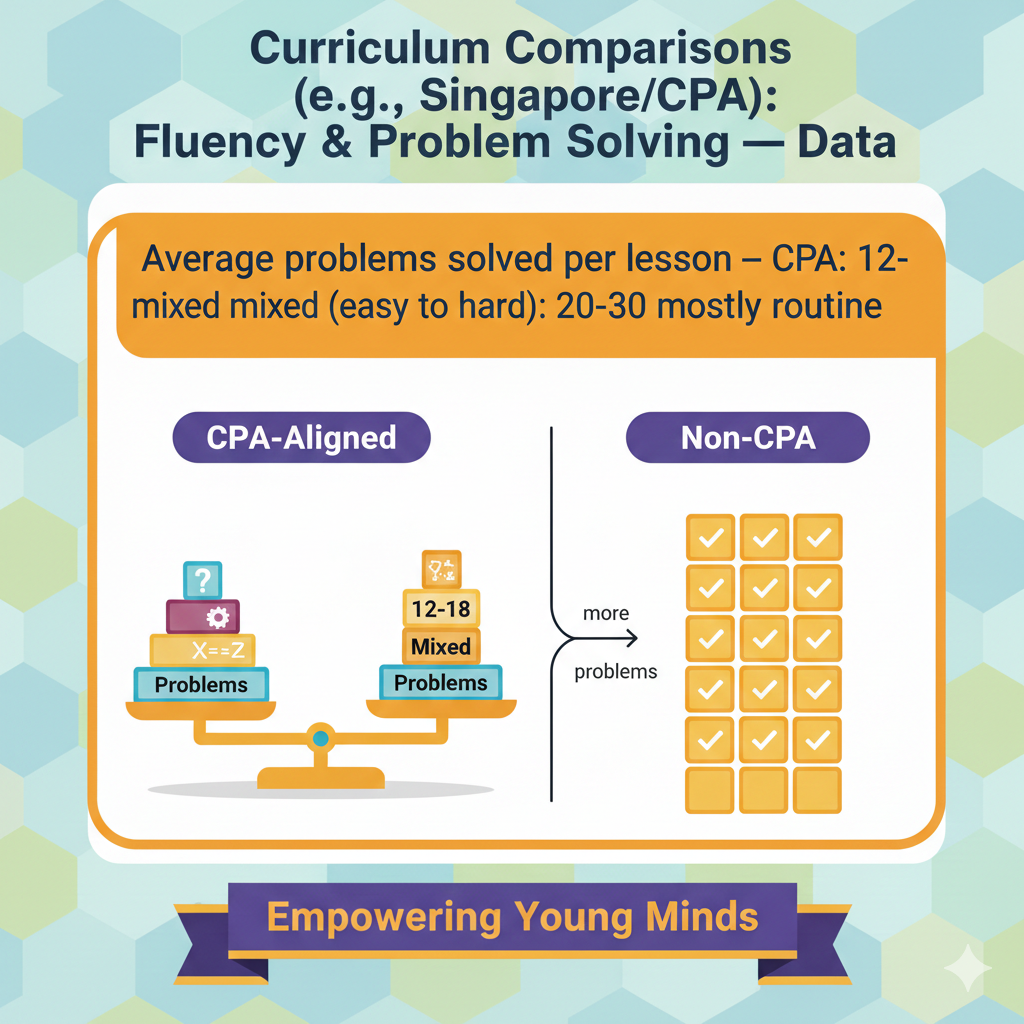
3) Average problems solved per lesson — CPA: 12–18 mixed (easy to hard); non-CPA: 20–30 mostly routine
What this means
More is not always better. In CPA lessons, students solve fewer total items, but the set is curated. The work begins with simple checks to warm up the skill. It then moves to medium and multi step items that ask for choice, model use, and reasoning.
By contrast, many non-CPA sets are long and flat. They include many similar problems that drill one rule. Students may finish fast, but they do not stretch. The goal should be balanced practice that builds fluency and transfer, not just speed on one pattern.
How to act
Design a practice set with a clear arc. Start with four or five quick items that confirm key facts. Move to five or six items that mix numbers or contexts and force a decision. End with three or four word problems that need planning and a model.
Limit total count to a range of twelve to eighteen. If students finish early, offer a challenge variant of the last item. Track the time it takes to finish each segment. If the warm up eats too many minutes, trim it next time. If the final tasks always get cut, guard those minutes at the start.
At home, ask your child to pick their best three finished items and explain the strategy used in each. If they used one method for all, ask them to solve one problem again with a different method and tell which one they prefer and why.
Over time, this pattern raises depth without bloating homework. It makes space for thinking while keeping enough repetition to build comfort with facts.
4) Non-routine tasks in weekly assignments — CPA: 30–40% of items; non-CPA: 5–15%
What this means
Non-routine tasks are problems that do not look like the last example. They make students think before they act. In CPA programs, about one third to almost half of weekly work includes these types of problems. Students face puzzles, patterns, missing steps, and word stories that need a plan.
In many non-CPA programs, the share is much smaller. Most items repeat the same move with new numbers. That kind of practice can build speed, but it does not grow flexible thinkers. When students see fresh forms, they learn to pause, model, and choose a path.
This is how they get ready for real life math, where the problem never tells you which method to use.
How to act
Set a weekly target for non-routine work. If you assign twenty items in a week, aim for at least six to eight that make students plan. Use simple language but new twists. Change the context, flip the question, or hide extra data that must be sorted.
Encourage students to start with a drawing or a bar model. Ask them to write one sentence that names the plan, like split the total into equal parts or compare the two rates over one hour. Keep the numbers friendly so the effort goes into thinking, not heavy calculation.
At home, you can turn routine items into non-routine by asking what if questions. If one problem asks for the total, ask next how many more or what if one part grows by two. Track how your child reacts. Do they freeze or do they reach for a model.
Praise the habit of drawing first. Over a month, increase the share a little each week. You will see students grow braver with new forms and learn to check their plan before they compute.
5) Concrete–Pictorial–Abstract (CPA) sequence use — CPA curricula: 90%+ of new topics follow it; non-CPA: under 25%
What this means
The CPA path is simple. First, students touch and move real or physical objects. Then, they draw or read pictures that stand for those objects. Last, they work with symbols, like numbers and signs. This path respects how the brain learns.
It builds meaning before memory. In strong CPA programs, almost every new topic walks this path. Students do not rush to symbols. They earn them. In many non-CPA programs, the path is rare. Teachers may show a rule or a formula first and give pictures only as decoration.
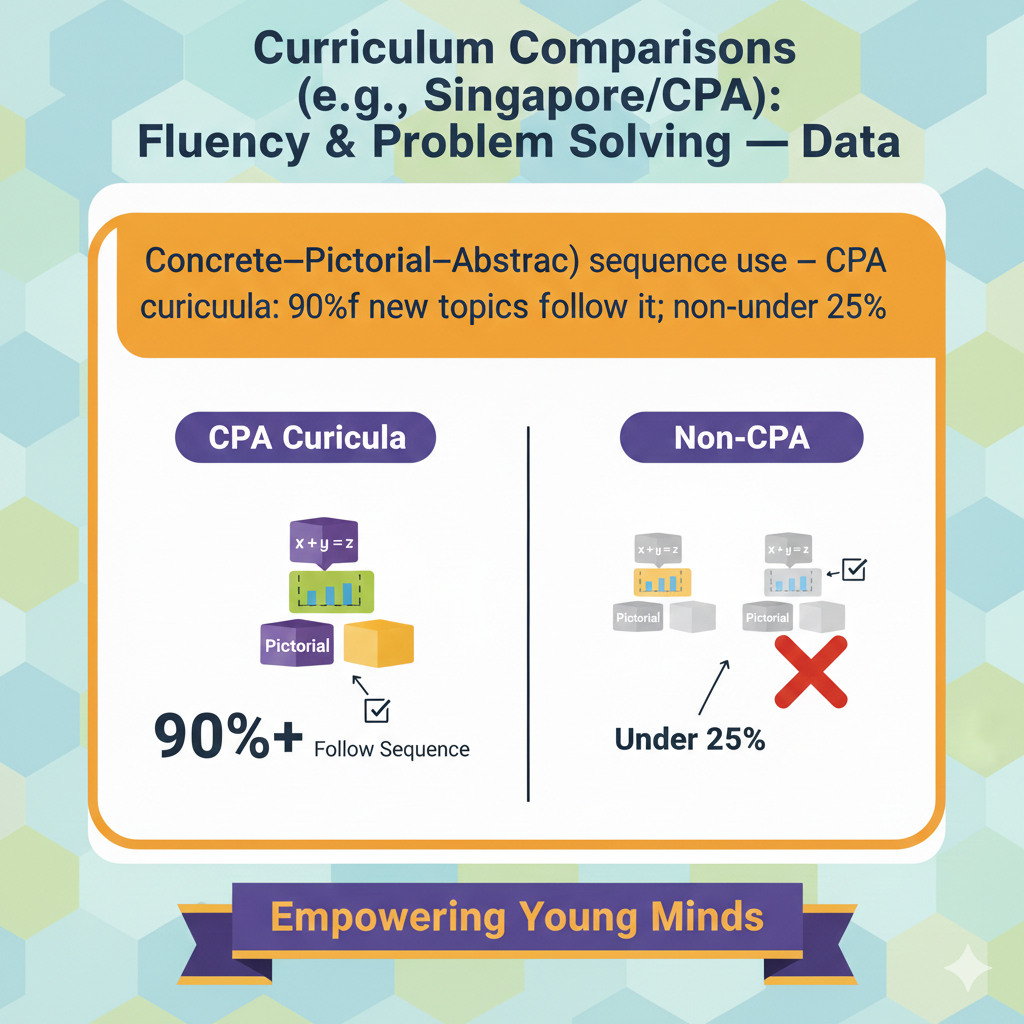
That skips the deep link between ideas and symbols. When the link is weak, later units fall apart, and students need to relearn the same ideas again and again.
How to act
Plan lessons with the three steps in mind. Start with real things your students can hold or imagine clearly. Use base ten blocks, fraction strips, or simple paper cutouts. Move to clean drawings that match the actions they did. Use number bonds, arrays, and bar models.
Only then write the equations and steps. Before you leave the abstract stage, ask students to point back to the model and say what each part means. If your class is older, you can still use CPA. For ratios, act out recipes with cups of water and syrup, draw double number lines, and then write the proportion.
For area, build shapes with tiles, sketch the layout, and then apply the formula. At home, ask your child to show the same idea in all three ways. If they can only do one, slow down and rebuild the other two. Keep a small kit of simple tools in a box so it is easy to start. Over time, this habit turns shaky rules into solid sense.
6) Bar-model use in word problems (Grades 3–6) — CPA: 70–85% of multi-step problems; non-CPA: 5–20%
What this means
Bar models are simple pictures made of rectangles that show parts and wholes. They help students see what the story is asking before they try to compute. In CPA classrooms, bar models are the default tool for many word problems, especially ones with two or three steps.
Students draw the bars, label the known parts, and mark the unknown. This visual frame turns a noisy story into a clear shape. In many non-CPA settings, bar models are rare. Students try to jump straight to an equation, and they often choose the wrong one.
ithout a model, they may add when they should compare, or they may miss a hidden step. The bar model slows the rush and brings the plan into view.
How to act
Teach one bar model at a time. Begin with part–whole models for totals, then move to comparison models for differences, and later to ratio models for rates. Keep the drawings neat but not perfect. The goal is thinking, not art.
Give short daily stories and ask students to draw the bars before they write any numbers. Ask them what the long bar stands for and what the shorter bars stand for. Push them to mark the unknown with a clear label. After solving, ask if the bars match the answer.
At home, when your child faces a word problem, say show me the bars first. If they resist, draw the first one together and let them finish it. Keep using bars even when the numbers get large. The picture stays the same, and that gives comfort when the math gets tougher.
Over weeks, you will see fewer wild guesses and more steady plans.
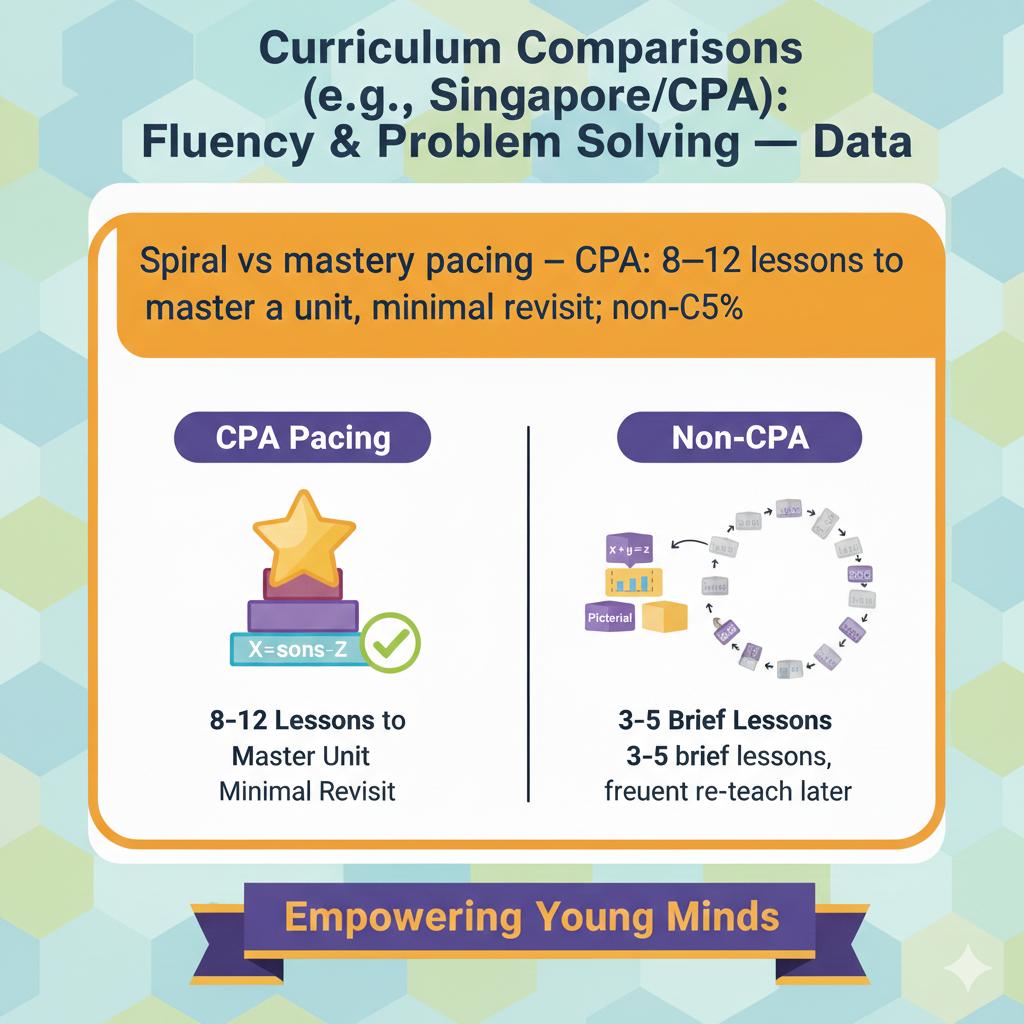
7) Spiral vs mastery pacing — CPA: 8–12 lessons to master a unit, minimal revisit; non-CPA: 3–5 brief lessons, frequent re-teach later
What this means
Spiral pacing means you touch a topic briefly, move on, and come back many times. Mastery pacing means you stay with a topic long enough to get it solid and then move on with only light review. CPA programs choose mastery more often.
They give a unit enough time, usually eight to twelve lessons, for students to build models, practice moves, and handle mixed problems. After that, only small refreshers are needed. Many non-CPA programs rush a unit in three to five lessons.
Students pass the quiz, but the ideas fade fast, so teachers must reteach. That cycle eats time and lowers confidence.
How to act
Map your units with honest time. List the key skills and the models for each. Plan days for launch, guided work, independent practice, and mixed problem solving. Protect time for error analysis and for non-routine work. Do not cut the final mixed days, even if the early lessons run long.
If needed, trim the number of routine items and keep the thinking days. Use quick checks every two or three lessons to see who needs a small group. If a few students lag, give them targeted help while the class moves. Avoid whole-class reteach unless a core idea is broken for most students.
At home, help your child build a habit of quick review. After a unit ends, spend five minutes twice a week on one favorite problem type from that unit. Keep it light and fun. A short mastery boost beats a long spiral drag. Over time, this pacing lowers stress, deepens skill, and gives room for rich tasks.
8) Average lesson length focused on a single objective — CPA: 35–45 minutes; non-CPA: 15–25 minutes before topic shifts
What this means
A strong lesson stays with one clear goal long enough for students to see, try, and own it. In CPA classrooms, that focus window is about thirty five to forty five minutes. The teacher launches the idea with a model, guides a few examples, and then lets students work on problems that grow in challenge.
There is time to think, to draw, to check, and to talk. In many non-CPA lessons, the topic shifts after fifteen to twenty five minutes. Students start with a rule, do a few short items, and then switch to a new mini topic.
The quick change may feel lively, but it often breaks thinking. Brains need quiet focus to build strong links. When we cut focus time, we trade depth for motion, and the learning does not stick.
How to act
Choose one objective per day and state it in plain words. Tell students exactly what they will be able to do by the end, like use a bar model to compare two amounts or write an equation from a story. Plan a tight arc that fills the focus window.
Spend five to eight minutes on a concrete or pictorial launch. Spend eight to twelve minutes on guided examples that move from easy to medium. Give twelve to eighteen minutes for independent problem solving with your coaching.
Reserve three to five minutes to share one or two student strategies and to reflect on what worked. Do not add side skills or surprise detours. If a new question pops up, note it for tomorrow. At home, pick one skill for each study session and stick to it.
Set a simple timer for twenty minutes of deep focus, then a short break, then another ten minutes if energy is good. End by asking your child to say in one sentence what they learned and to show you one model that proves it.
This steady focus is calm, respectful, and powerful. It tells students their thinking matters enough to deserve time.
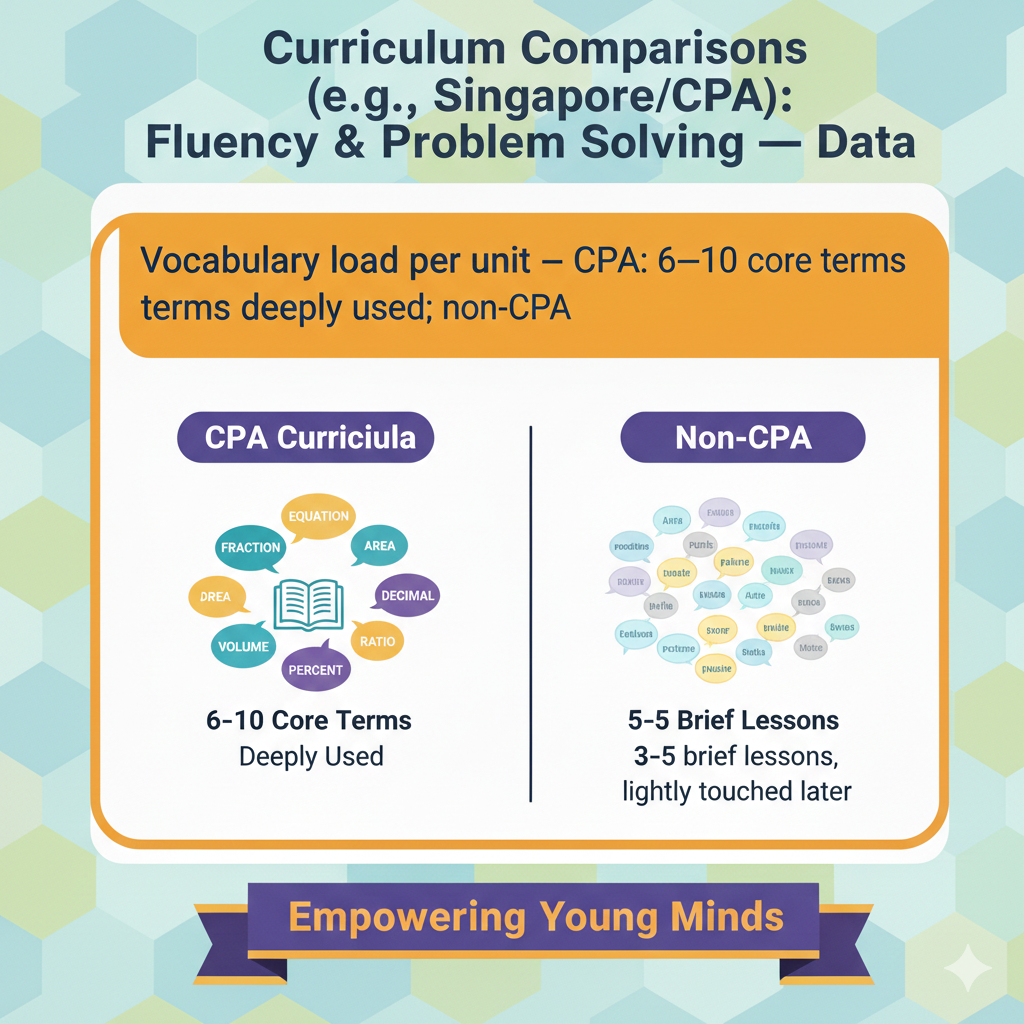
9) Vocabulary load per unit — CPA: 6–10 core terms deeply used; non-CPA: 15–25 terms lightly touched
What this means
Words are tools for thinking. When there are too many new words at once, the tools get heavy and clumsy. In CPA programs, each unit settles on a small group of six to ten key terms, like sum, difference, factor, multiple, ratio, and unit rate.
These words are used many times in problems, models, and talk. Students learn not just the definition, but how the word helps them plan and explain. In many non-CPA programs, a unit may list fifteen to twenty five terms.
Each word shows up once or twice and then vanishes. Students try to memorize, but the meaning fades. A smaller, deeper set builds real power.
How to act
Before a unit starts, choose the few words that truly matter for problem solving. Put them on a simple wall strip with a picture and an example. Use the same words in your talk, your prompts, your exit tickets, and your feedback.
Ask students to say the word as they point to the model part it names. When a tempting new term appears, decide if it serves the plan. If not, skip it for now. Have students keep a tiny personal glossary with space to draw.
Ask them to write their own short, friendly definition and to add one problem where the word was helpful. At home, make word cards with drawings. Review two or three cards a day and ask your child to invent a quick story problem that uses one word from a card.
Keep the language precise and simple. When students carry clean words in their heads, they can carry clean plans in their work. Less noise, more sense. This is how vocabulary becomes a lever, not a load.
10) Use of math journals or reasoning prompts — CPA: in 4–5 lessons per week; non-CPA: 1–2 lessons per week
What this means
Writing about math locks in thinking. A journal does not need long essays. It needs short, honest answers to simple prompts like what was your plan, why did you choose this model, or where did you change your mind. In CPA classrooms, students write or speak to a reasoning prompt almost every day.
This turns quiet steps into clear ideas. It also gives the teacher a window into the mind, not just the final answer. In many non-CPA programs, this habit appears only once or twice a week, often as a check-box task. That is not enough to shape thinking. Like any skill, explaining needs steady reps.
How to act
Add a two minute reasoning prompt to the end of most lessons. Keep the questions small and concrete. Ask what was the first move you made, what model matched the story, what mistake did you fix, or what would you do if the numbers were larger.
Use sentence starters to lower the barrier, like My plan was to or The bar model shows that. Invite students to sketch right in the journal. Do not grade for spelling or grammar. Respond with quick notes that name the good choice, like clear plan or model fits the question.
Once a week, choose one journal entry to share and discuss as a class. At home, ask your child to teach you one problem in sixty seconds. Have them say the plan, show the drawing, and point to the step where the answer appears.
Record a short voice note if writing feels hard. The point is not pretty prose. The point is a clear mind talking. Over time, this habit builds confidence and memory. Students learn to think in sentences, not just in steps.
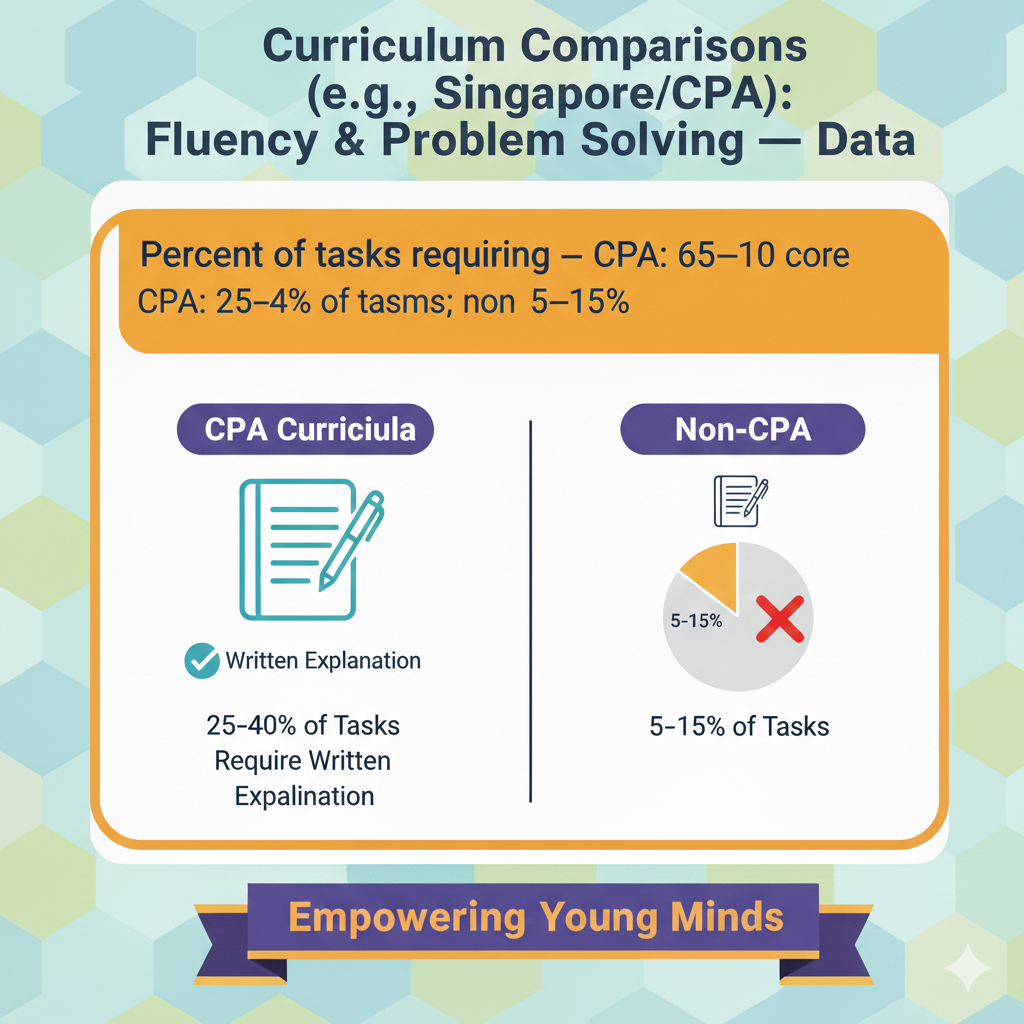
11) Percent of tasks requiring a written explanation — CPA: 25–40% of tasks; non-CPA: 5–15%
What this means
When a task asks for an explanation, it turns on a different part of the brain. The student must name the plan, link steps, and justify the choice. CPA programs bake this into a quarter to almost half of daily work. It is not extra credit; it is part of the task.
Many non-CPA sets ask for words only now and then, and the prompts are vague. Without steady practice, students learn to fear explanation, or they give a sentence that repeats the numbers without meaning. The right share and the right wording build a habit of sense-making that lasts.
How to act
Mark one out of every three or four problems as explain. Keep the prompt specific. Say explain why a bar model is better than drawing tally marks for this story or show how you knew to subtract instead of add. Ask for two or three sentences tied to a simple sketch.
Use a tiny rubric with three ideas: plan named, model shown, reason given. Give quick feedback that points to the missing piece. Rotate the focus. One day, ask for the plan. Next day, ask for the reason. On another day, ask for a check of the answer using a different method.
At home, when your child finishes a problem set, pick two problems and ask for a short talk-through. If they say I just knew, gently press by asking which clue in the story told you to do that. Keep it light and kind. The goal is to make explanation normal, not scary.
With time, students start to predict the question and build their reasoning as they solve. That is the sweet spot.
12) Word problems before symbol rules — CPA: models first in 70–90% of topics; non-CPA: rules first in 60–80% of topics
What this means
In many classrooms, students meet a rule before they see a reason. They learn a step list and then try to fit it to stories. CPA flips this. Most topics start with a word problem or a simple real context. Students use blocks or a bar model to make sense of the story.
Only after they can show the idea do they write the equation and name the rule. This path is slower at the start but faster later, because the model gives a memory hook. When rules come first, students can perform but not transfer. When models come first, students can explain, adapt, and check.
How to act
Launch new topics with a short, clean story that invites a model. Keep the numbers friendly and the language simple. Ask students to show the story with objects or bars and to label the unknown. Guide a discussion that points from the model to the equation.
Only then name the rule. For example, in division with remainders, start with groups of counters and a bar that does not split evenly. Talk about what the leftover means in context. Then write the division sentence and show where the remainder lives.
At home, if homework starts with a rule, cover it for a moment and ask your child to invent a story that fits the numbers. Have them draw the model and then reveal the rule. This small shift tunes the brain to meaning. Over weeks, you will hear more because and fewer I just did it. That is true progress.
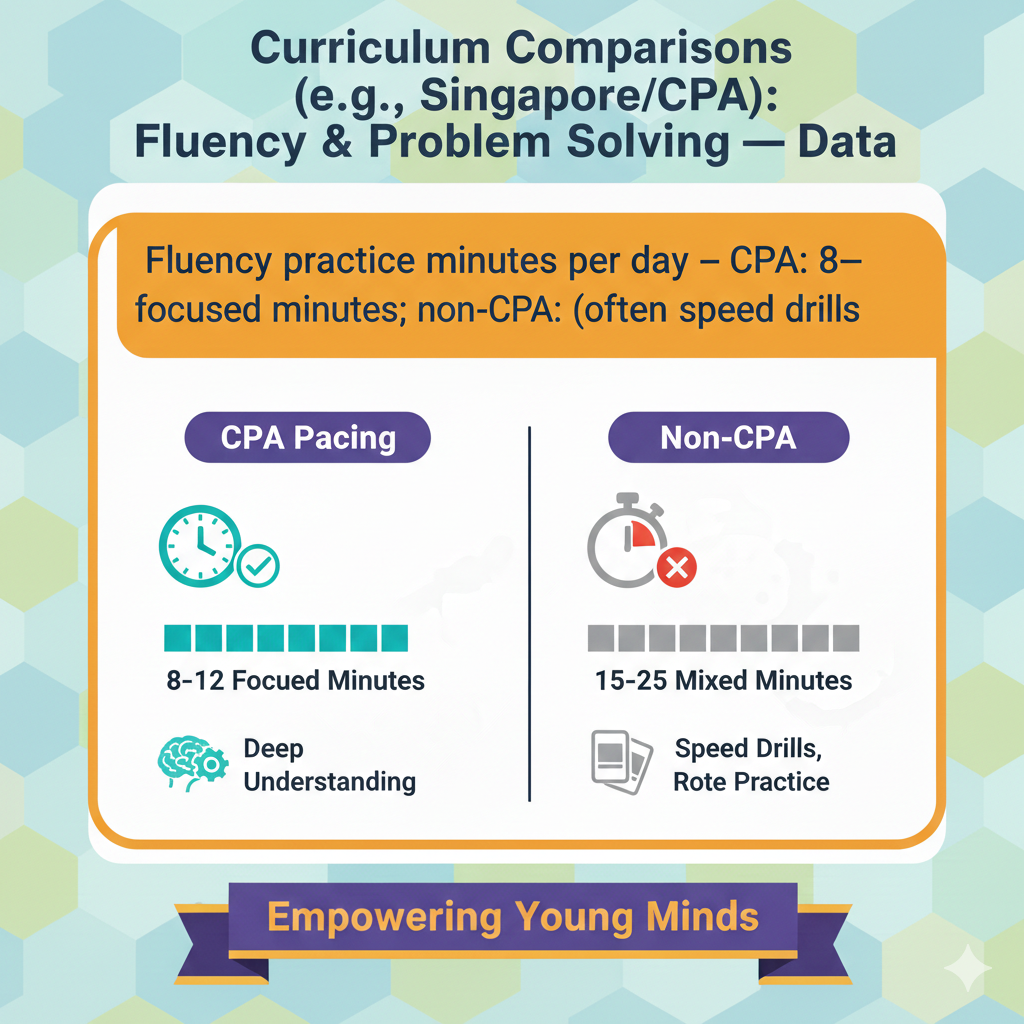
13) Fluency practice minutes per day — CPA: 8–12 focused minutes; non-CPA: 15–25 mixed minutes (often speed drills)
What this means
Fluency is being quick and accurate with facts and small steps. It should feel calm and clear, not rushed. In CPA settings, fluency gets a short, tight block of eight to twelve minutes. The practice is focused on a small set of facts or skills that link to the day’s lesson.
Students use strategies, not guessing. They might break numbers, use number bonds, or relate a hard fact to an easy one. The work is brisk but not frantic. In many non-CPA programs, fluency eats a larger chunk of time and leans on speed races.
That can raise stress and teach students that math is only about fast answers. A shorter, smarter block keeps the brain fresh for problem solving while still building the quick recall that supports multi-step work.
How to act
Plan a daily fluency window that feels like a warm up, not a workout. Choose a small target such as make tens, doubles plus one, or multiply by fives using skip-counting and arrays. Use materials that show structure, like ten-frames or dot patterns, for the first few minutes, then fade to mental moves.
Keep the pace steady with a simple call and response. Ask students to explain a strategy for one item at the end to lock in the idea. Rotate targets across the week so gaps close without overload. If students get tense, lower the speed and praise clear strategies.
At home, set a ten minute routine with two parts. Start with three minutes of strategy practice using simple dots or fingers. Then switch to five minutes of mixed facts with a focus on accurate first, quick second. End by asking your child to teach you one strategy they used.
This daily rhythm keeps fluency sharp, protects time for deep tasks, and strengthens confidence.
14) Mix of problem types in daily practice — CPA: 40–60% varied (transfer, multi-step); non-CPA: 10–25% varied
What this means
When practice includes a healthy mix, students must choose a method, not just repeat one. In CPA practice sets, nearly half the items are varied. Some are word stories, some are comparisons, some ask for building a model, and some ask for checking an answer with a second path.
This variety trains the mind to sort, plan, and adapt. In many non-CPA sets, only a small slice is varied. Most items look the same, and students can switch off their brains and run the same steps. That may feel smooth, but it hides weak understanding.
True fluency shows up when the student meets a new shape of problem and still knows what to do.
How to act
Design practice like a small playlist with different songs. Begin with a couple of plain items that refresh the skill. Then add items that ask students to pick a model or to explain a choice. Include at least one compare question where two methods must be judged for efficiency.
Place a transfer item that uses the same math in a new story, such as moving from whole numbers to money or from length to time. End with a quick self-check where the student proves the answer with a second method or an estimate. If a set becomes too long, cut duplicates and keep the varied ones.
At home, take a routine worksheet and change two or three items by writing a short story around them or by asking which method would be faster and why. Keep numbers friendly so the brain works on choosing, not on grinding.
Over weeks, students will begin to pause, scan, and select before they compute. That pause is the mark of a growing problem solver.
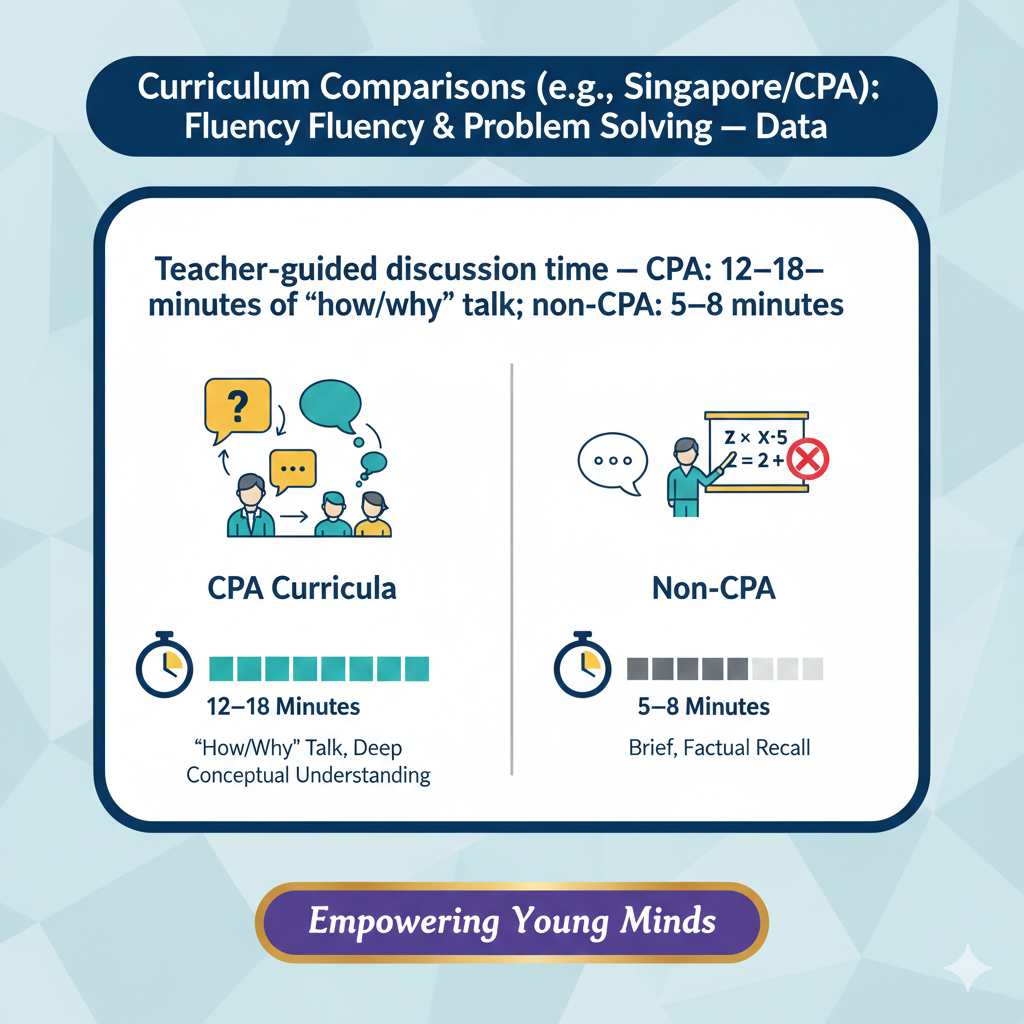
15) Teacher-guided discussion time — CPA: 12–18 minutes of “how/why” talk; non-CPA: 5–8 minutes
What this means
Talking about methods turns steps into sense. In CPA lessons, the teacher sets aside twelve to eighteen minutes for guided math talk. This is not the teacher lecturing the whole time. It is a structured chat where students share models, compare plans, and defend choices.
The teacher presses for clarity with short prompts like what does this part stand for or how do we know this equals that. In many non-CPA rooms, talk time is much shorter and focuses on answers, not reasons.
Without enough space to explain and critique, students can hold shaky ideas that look fine on paper but fall apart in new settings.
How to act
Plan discussion like a mini show-and-tell. Select two or three student solutions ahead of time that highlight different moves. Sequence them from concrete to abstract or from common to clever.
Give each student a minute to present, then open a brief exchange where classmates name one strength and ask one question. Keep prompts predictable so students know how to join, such as point to the part of the model that shows the unknown or show where the numbers in your equation appear in the drawing.
Use neutral language so mistakes feel safe to fix. Capture one key sentence on the board as a class takeaway, like the long bar is the total or the unit rate is for one. At home, after homework, ask your child to pick one problem and tell the story of how they solved it, including a moment where they almost went the wrong way and how they caught it.
This habit grows the muscle of sense-making and teaches students that math is a talk, not just a page.
16) Use of manipulatives (K–3) — CPA: in 60–80% of lessons; non-CPA: in 15–30% of lessons
What this means
Young children learn by touching and moving. Manipulatives like counters, cubes, ten-frames, bead strings, and fraction tiles give ideas a body. In CPA classrooms, these tools appear in most early-grade lessons.
They are not toys; they are thinking tools that show how numbers join, split, and compare. Students build patterns, act out stories, and check ideas with their hands. In many non-CPA settings, manipulatives show up only now and then, often as a reward or a break.
When hands are left out, many students fail to link symbols to meaning. Later, they may know rules but not why the rules work.
How to act
Make manipulatives a normal sight on desks. Choose a small core set so routines stay simple. Begin a lesson by letting students model the story with counters or blocks before any writing. Ask them to say what each group or stack stands for.
Move to drawings once the idea is clear, then to equations. Do brief cleanups and quick counts to keep the pace brisk. Teach students how to put tools away fast so materials do not steal time. When a child is stuck, invite them back to the tools without shame.
At home, keep a small kit in a box. Dry beans can be counters, paper strips can be fraction pieces, and bottle caps can be place value disks. Ask your child to show you a problem with the pieces and then draw it.
As the weeks pass, fade the tools when your child can picture them in their head, but bring them back when a new idea appears. The point is not to stay in concrete forever; the point is to build a strong bridge to pictures and symbols.
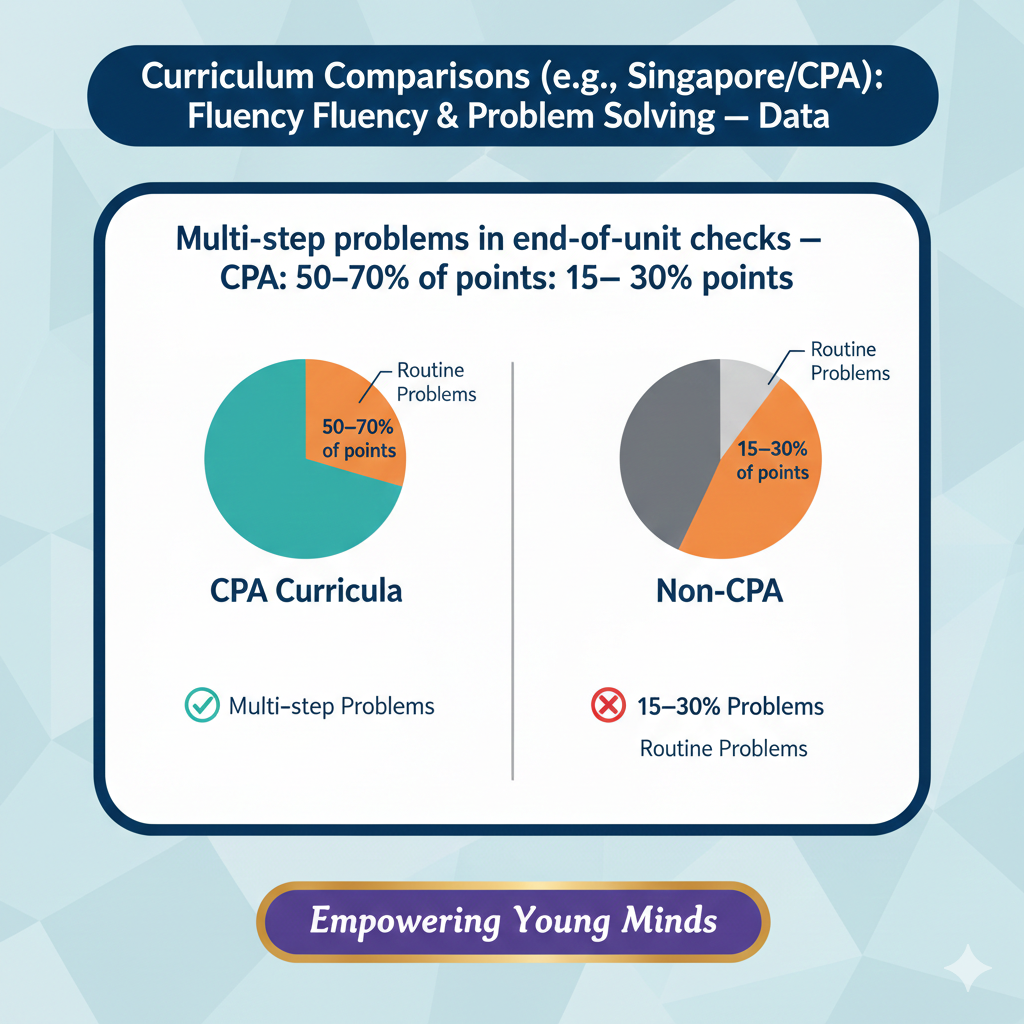
17) Multi-step problems in end-of-unit checks — CPA: 50–70% of points; non-CPA: 15–30% of points
What this means
End-of-unit tests should measure what we value. If we want real problem solvers, the test must include many multi-step questions. In CPA programs, over half the points come from problems that need a plan, a model, and more than one operation.
Students must read a story, choose a model like a bar diagram or array, and then decide the right steps. This balance shows if learning is deep and useful. In many non-CPA programs, most points come from single-step items.
Students can score well by following a short rule, even if they cannot handle a two-step story. That may look good on paper, but it does not prepare students for the next grade or for real-world math, where problems rarely say which rule to use.
How to act
Design your end checks so the point weight matches your goals. Start by listing the unit’s core skills and the models used to show them. Write four or five rich stories that ask students to choose a method and to explain one step.
Keep the language simple and the numbers friendly, but ask for planning. Mix in only a few single-step items to confirm quick facts. Include space for a sketch, and remind students to label the unknown in their model. Grade with a clear, simple rubric that rewards plan, model, and accuracy in that order.
Offer partial credit when the plan and model make sense even if one computation slips. After scoring, sort the results by step type to see where students stumble. At home, when review time comes, skip long packets of one-step practice.
Instead, choose three strong word problems and ask your child to show you the plan before calculating. Ask where the second step shows up in the model. This steady focus on multi-step thinking builds stamina and the habit of checking whether each step still matches the story.
Over time, students stop guessing operations and start reasoning from structure.
18) Average cognitive demand of tasks (low/moderate/high) — CPA: 50–65% moderate–high; non-CPA: 20–35% moderate–high
What this means
Cognitive demand is the level of thinking a task asks for. Low demand means follow a template. Moderate means make a choice and connect ideas. High means create a plan, justify it, and sometimes try more than one path.
In CPA classrooms, over half of daily work lives in the moderate to high range. Students must select a model, argue for a strategy, and reflect on errors. In many non-CPA settings, the share of moderate to high tasks is smaller.
Most items tell students exactly what to do, so thinking is shallow. When the demand stays low, students may look fluent but struggle with new problems. When the demand is right, students grow both fluency and flexibility.
How to act
Tune the demand of your tasks with small tweaks. Take a routine problem and hide the operation words so students must choose. Replace a tell-me step with a show-me prompt, asking for a diagram before an equation. Offer two solution paths and ask which is more efficient and why.
Add an estimation checkpoint where students must predict a reasonable range before solving. Include one error-analysis item where a wrong step is shown and students must diagnose it. Keep the numbers light so the load sits on thinking, not on heavy arithmetic.
During class, give quiet think time before any hands go up, then invite short partner talk to surface options. At home, print two similar problems with different contexts and ask your child to explain whether their plan stayed the same or changed.
Praise careful choices, not just correct totals. Over weeks, this steady raise in demand builds a mindset of sense-making. Students learn to scan, plan, solve, and reflect. That cycle is the engine of strong math.
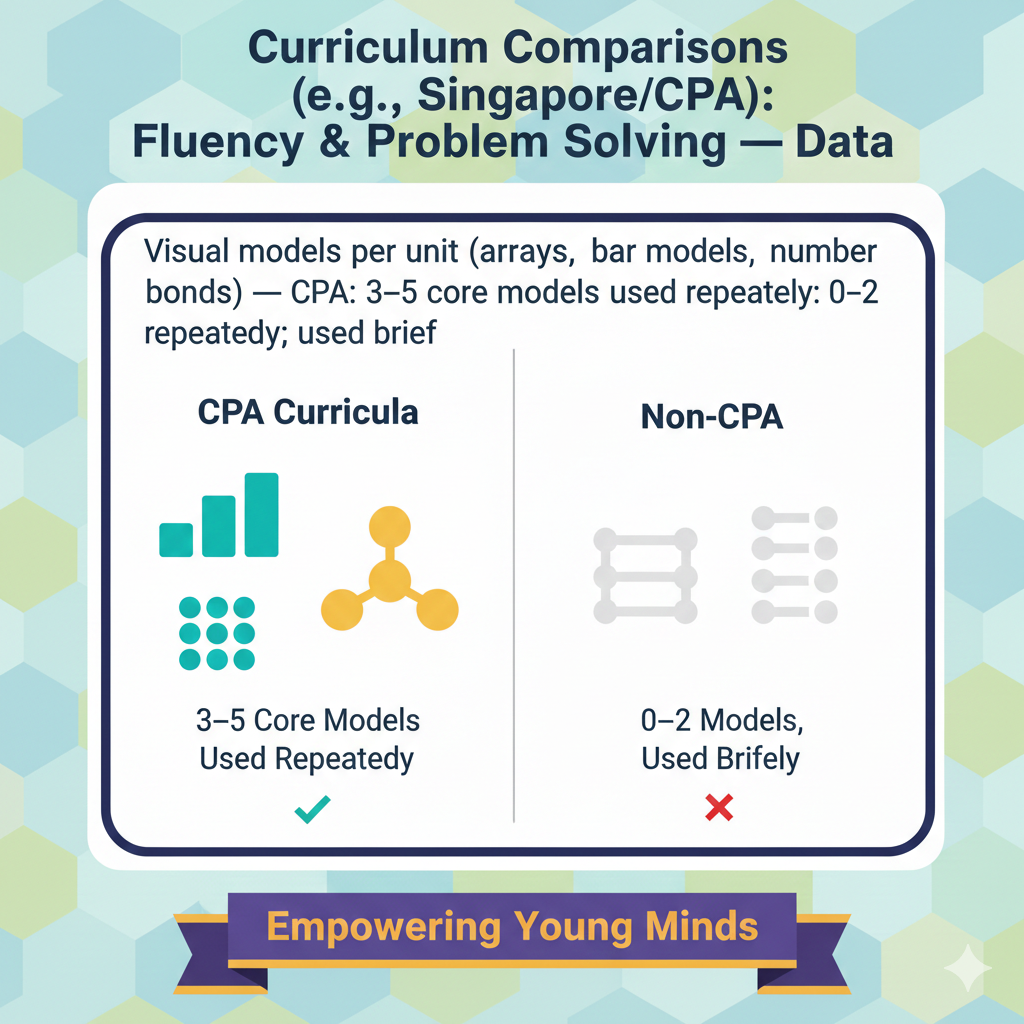
19) Visual models per unit (arrays, bar models, number bonds) — CPA: 3–5 core models used repeatedly; non-CPA: 0–2 models, used briefly
What this means
Models are the bridge from ideas to symbols. Too many models can confuse. Too few models leave gaps. CPA programs pick a small set of three to five models for each unit and use them again and again.
For example, number bonds show parts and wholes, arrays show multiplication and area, and bar models show totals, comparisons, and ratios. By seeing the same model across many problems, students build a strong mental picture.
In many non-CPA programs, models appear as decoration, or a new model pops up in each lesson and then disappears. That makes it hard for students to know which model to reach for when the story changes.
How to act
Choose your unit’s backbone models on day one. Teach each model with a tight routine: name the model, show what each part stands for, and label the unknown. Reuse the same models across contexts so students connect ideas.
For example, use arrays for both multiplication facts and area of rectangles, then extend to composite area by combining arrays. Use number bonds for whole numbers, then again for fractions and decimals to show equivalence and decomposition.
In your anchor charts, keep clean examples with simple labels. During practice, cue students to pick a model first, then write the equation second. When students try a model that does not fit, treat it as a smart start and coach the shift to a better fit.
At home, keep a small sketch library. Ask your child to draw a number bond for a part-whole story, an array for a product story, and a bar model for a compare story. Rotate these so the choice grows automatic. With repeated use, models become tools, not art.
Students gain speed in seeing structure, and that speed makes hard problems feel possible.
20) Error analysis items (find and fix mistakes) — CPA: 2–4 per lesson/week; non-CPA: 0–1
What this means
Learning sticks when students spot and fix mistakes. Error analysis trains the eye to see structure and the mind to check steps. In CPA classrooms, students meet two to four error items across lessons each week. Some show a wrong model.
Some show a correct model with a wrong equation. Some show a right equation with a slip in place value or a missing label. Each kind asks students to slow down, name the issue, and repair it. In many non-CPA rooms, error analysis is rare.
Students see only polished examples and may think good math means no errors. When they do make a mistake, they feel shame instead of curiosity.
How to act
Build a simple routine for error hunts. Post one short solution on the board with a hidden flaw. Ask students to work silently for a minute to find the first place the work goes off track. Invite them to mark the error, explain it in one sentence, and rewrite the step that fixes it.
Use neutral language like this step does not match the model rather than this is wrong. Vary the error type so students learn to check alignment between story, model, equation, and computation. Keep a weekly mini-collection of common class mistakes and turn it into a five-minute Friday clinic.
Celebrate sharp catches as wins for the whole group. At home, after finishing homework, pick one solved problem and ask your child to invent a common mistake someone might make, then show how to catch it fast.
This habit builds self-checking, reduces repeated slips, and shifts the class culture from fear to growth. Over time, students start to ask themselves whether their steps still match the picture, and that question saves them on tests and in life.
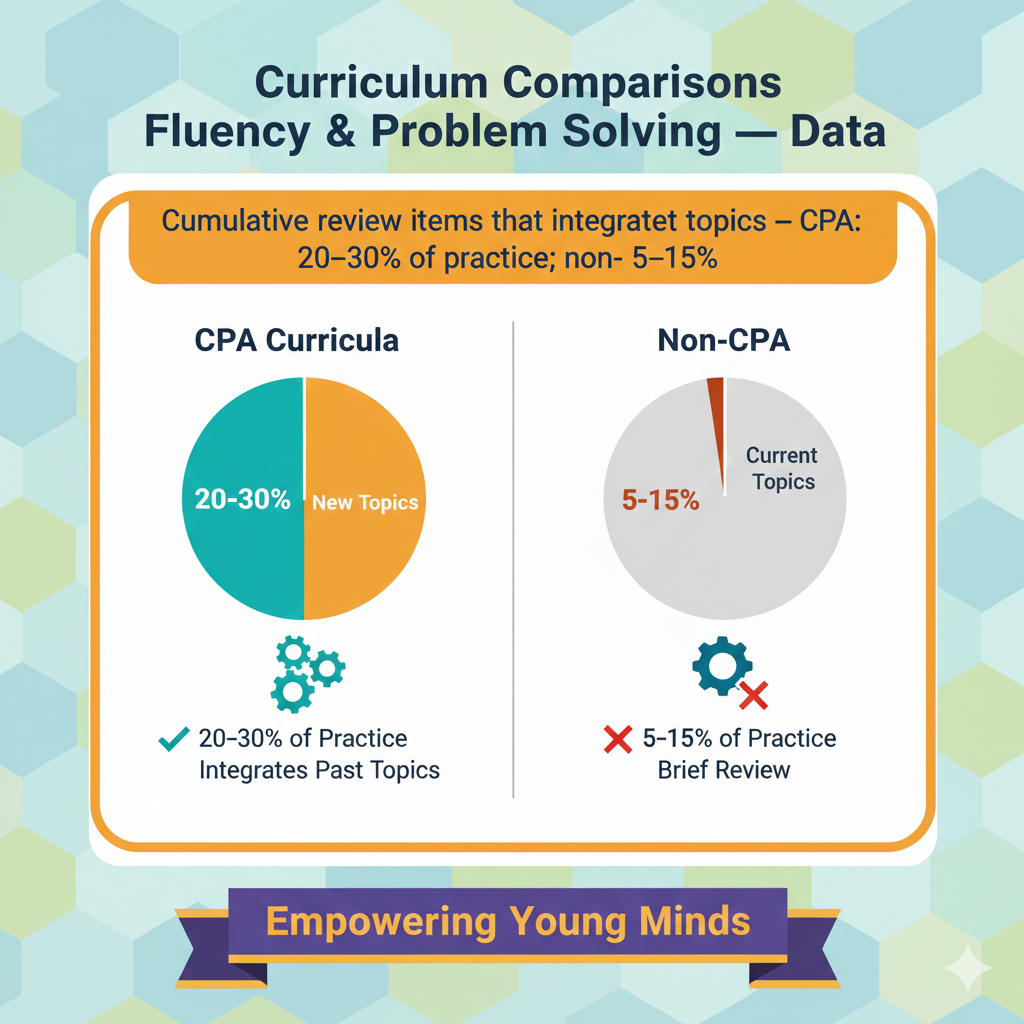
21) Cumulative review items that integrate past topics — CPA: 20–30% of practice; non-CPA: 5–15%
What this means
Strong math learning is layered. New ideas sit on old ideas. Cumulative review means today’s practice still touches skills from last month and last term. In CPA programs, about a quarter of daily work blends past topics with the new one.
A fraction task might use bar models from whole-number units. A ratio problem might ask for area reasoning from geometry. This steady mix keeps old skills alive and shows students that math ideas connect. In many non-CPA settings, review happens only before tests or as a big packet at the end of a term.
Skills go cold, and reteaching eats time. When review is small and frequent, memory stays warm and lessons move faster. At Debsie, our courses bake this in so children meet just enough old ideas each week to stay fluent without feeling buried.
How to act
Plan short spirals inside daily practice. Add two or three items that use last unit’s model in a new story. Keep numbers friendly so the brain works on links, not heavy steps. Ask students to name which past tool helped and why.
Use exit tickets that include one review item with a quick model sketch. Track which past skills slip and refresh them in your next warm-up. At home, spend five minutes every other day on one favorite problem from a past unit and ask your child to solve it with the model they used back then.
Praise the link they make. If you want a simple way to structure this, try our free Debsie trial class where children practice a tiny, smart spiral in each lesson and feel the joy of remembering without cramming.
22) Time to independent practice after concept launch — CPA: 12–20 minutes (after modeling and discussion); non-CPA: 5–10 minutes
What this means
Students need calm space to try the new idea on their own while the model is still fresh. In CPA lessons, teachers protect a twelve to twenty minute window for quiet solving right after the launch and guided examples.
This is when the mind tests a plan, draws, checks, and fixes. In many non-CPA classes, independent time is short. Students start, then the bell rings, or the class shifts topics. Shallow time creates shallow learning.
With a longer block, the first confusion gets handled, and students leave class knowing they can do it. In Debsie classes, this block is sacred. Children feel trusted to think, and teachers circulate to nudge, not rescue.
How to act
State one clear goal for the independent block and keep the room still. Put models on the board as a visual anchor and remind students to draw before they compute. Offer a simple help ladder: try the model, check the story, then raise a hand.
Resist the urge to reteach the whole class during this time. Instead, give short whispers that point back to the model. End the block with a two minute share from a student whose plan fits the model well. At home, set a timer for fifteen quiet minutes after you review one example with your child.
Ask them to solve two or three problems and to place a small dot next to any step that felt tricky. When time ends, they explain just those dotted spots. This routine creates focus, builds courage, and reduces the need for late-night reteaching.
If you want a ready-made structure, Debsie’s guided practice does this for you, step by step.
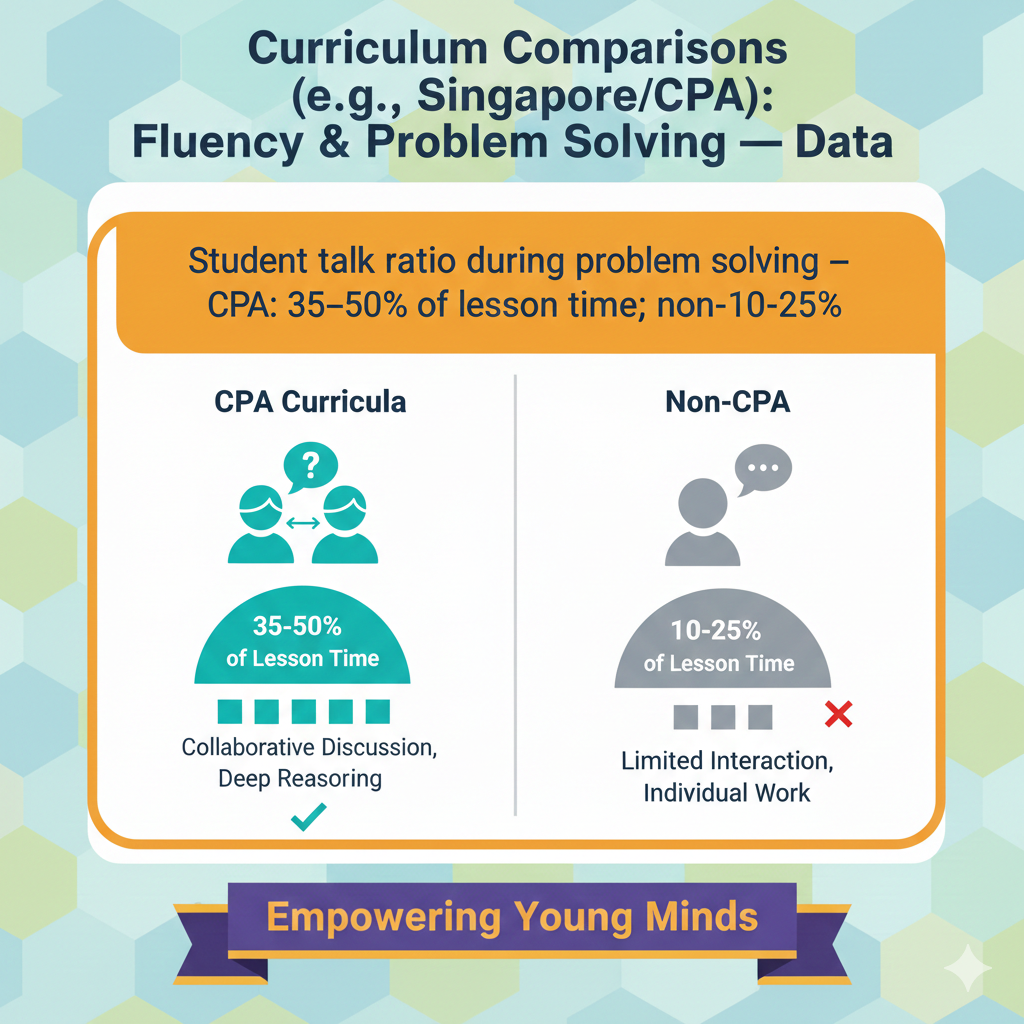
23) Student talk ratio during problem solving — CPA: 35–50% of lesson time; non-CPA: 10–25%
What this means
Students learn math by doing and by saying. Talk is not noise; it is thinking made visible. In CPA classrooms, students spend over a third of each lesson explaining plans, pointing at models, asking why, and comparing methods.
This talk is structured and brief, not random chatter. In many non-CPA programs, teacher voice fills most of the period. Students copy steps but do not test ideas with peers. Without student voice, false beliefs hide. With it, errors surface and can be fixed.
At Debsie, we script short partner prompts so every child speaks, not just the confident few.
How to act
Use predictable talk moves. After quiet think time, give each pair one minute to share plans while pointing to their drawing. Rotate roles so one student explains and the other asks a why question like where is the unknown in your model.
Keep it fast and focused. Bring two pairs to the board to share different models for the same story and ask the class which one gives a clearer path to the answer. Limit whole-class talk so many students speak for a short time rather than a few speaking for long.
At home, do micro-talks. After a problem, ask your child to explain the plan in twenty seconds. Then you restate it in your words and ask did I get it right. This small routine doubles clarity. For families who want help leading math talks, Debsie lessons include friendly prompts you can use tonight.
24) Use of challenge problems for fast finishers — CPA: in 70–90% of lessons; non-CPA: in 20–40% of lessons
What this means
Fast finishers should not sit idle or race into random enrichment. They need deeper versions of the same idea so they grow in breadth and care. CPA classrooms plan challenge problems for most lessons. These are not just bigger numbers.
They add a twist, a missing step, or a need to generalize a pattern. Students push their model, test a claim, and explain a choice. In many non-CPA rooms, extensions appear only sometimes, and they often jump to a new topic.
That splits attention and can widen gaps. Planned challenge keeps the class together while stretching those ready for more. In Debsie, every mission has a built-in extension that asks children to justify, compare, or optimize.
How to act
Prepare one challenge that stays in the same lane as the core task. Keep the language simple and the twist clear. Ask for a model plus a short reason. Examples include change one number so two different methods give the same answer, find two stories that fit the same bar model, or decide which plan saves more time and prove it.
Place the challenge on the back of the practice page or on a small card so fast finishers can flip and go without interrupting. Invite them to coach a peer by asking questions, not giving answers, once they finish. At home, when homework ends quickly, offer a what if version.
If your child added two ratios, ask what happens if the units shift to per minute or per hour. Praise careful reasoning, not just speed. If you want high-quality challenges without prep, Debsie’s course library has short extensions for every lesson that you can print or pull up on a phone.
25) Real-world context problems per unit — CPA: 8–12 varied contexts; non-CPA: 3–5 repeated contexts
What this means
Children learn faster when ideas feel real. In CPA programs, each unit includes many different real-life stories. A unit on multiplication might include arrays of seats, packs of pencils, garden beds, and tile patterns. A unit on fractions might use recipes, ribbons, money, and time.
This variety helps students see the same math under different faces. It prevents the habit of hunting for key words and pushes students to understand the structure of the problem. In many non-CPA programs, only a few repeated contexts are used.
Students get good at those stories but struggle when the setting changes. A broad mix of contexts builds flexible thinking, stronger transfer, and deeper memory because the brain links the same idea to many places.
At Debsie, we design missions so children meet a fresh but friendly context often, which keeps curiosity high and makes practice feel like discovery instead of drill.
How to act
Map your unit and pick eight to twelve simple, relatable contexts that fit your students’ world. Keep the numbers friendly so attention goes to the plan, not heavy calculation. Use visuals and quick props to set the scene, like a tray of bottle caps for an array or paper strips for ribbon fractions.
Rotate contexts during the week so no single story becomes a crutch. Ask students to label their bar models or arrays with words from the context because that tight link cements meaning. Invite short student-created stories that match the day’s model, then trade and solve.
At home, turn small daily moments into math, such as slicing fruit, sharing snacks, measuring water, or planning time for activities. Encourage your child to draw the model before computing and to say how this story is the same as another one they solved earlier in the week.
If you want ready-to-use context cards aligned to each skill, Debsie’s course pages include them, so you can click, print, and go in under a minute.
26) Re-teach cycles per unit — CPA: 1–2 targeted small-group cycles; non-CPA: 3–5 whole-class cycles
What this means
Re-teaching happens when first instruction does not stick. In CPA classrooms, because learning moves from hands to pictures to symbols and includes steady discussion, fewer students fall behind. Re-teach is done in small groups and is short, focused, and model-rich.
You might meet with four students for ten minutes to rebuild a bar model or to fix one step. In many non-CPA settings, reteaching happens to the whole class again and again. This burns time, frustrates students who already understand, and still may not help those who need a different approach.
A small number of targeted cycles signals that first instruction was strong and that support meets students where they are.
How to act
Use quick checks every two or three lessons to identify the exact snag. If students are missing the structure, go back to concrete or pictorial, not to louder lecture. Plan a short menu of small-group moves, such as rebuild the model with simpler numbers, narrate while drawing and have students echo the labels, or switch a confusing context to a clearer one.
Keep the group tiny and the aim single. End with one success problem and a micro exit slip. Return students to independent work as soon as they show a stable plan. Avoid defaulting to full-class reteach unless data shows a widespread gap in understanding the core model.
At home, when a concept wobbles, resist doing the whole worksheet together. Instead, pick one problem, act it out with objects, sketch the model, solve once, and stop. Celebrate the small win and try one more the next day.
This tight loop builds confidence without turning help into a crutch. If you want structured small-group plans, Debsie lessons include ready-made ten-minute rescue tracks that slide in without changing your whole day.
27) Computation-only items on tests — CPA: 25–40% of points; non-CPA: 55–75% of points
What this means
Computation matters, but it is not the whole story. Tests that weigh mostly computation reward speed with procedures and can hide weak understanding of structure. CPA-aligned assessments balance things. Only about a quarter to two fifths of the points come from bare-number work.
The rest measure modeling, reasoning, and multi-step problem solving. This balance ensures that students who can plan and explain are recognized, and it nudges teaching to value sense-making. In many non-CPA programs, tests lean hard on computation.
Students who have test nerves or who misread one step can lose many points, even if they can solve word problems when given time and a model. A better balance builds fairness and aligns testing with the real goal of math learning: to solve problems thoughtfully.
How to act
Audit your assessments. Count the points assigned to computation-only items and shift weight toward modeling and reasoning tasks. When you do include computation, choose items that reflect the facts and methods that feed the unit’s problem solving, not random drills.
Write prompts that require a small diagram, a sentence naming the plan, or a check with estimation. Give partial credit for a correct model and plan, even if a calculation slip occurs. Share the test blueprint with students so they know that showing thinking matters.
After the test, sort errors into two buckets, computation slips and plan or model gaps. Teach students how to fix each kind differently. At home, practice with short mixed quizzes that include a few bare-number items and several small stories where your child must draw first, then compute.
Praise clear models and careful checks. If you want assessments already balanced in this way, Debsie’s unit checks are built around models and multi-step items so children are rewarded for real thinking, not just fast fingers.
28) Transfer tasks (new situation, known idea) — CPA: 30–45% of practice; non-CPA: 10–20%
What this means
Transfer is when a child meets a fresh problem and still knows what to do because they see the same structure beneath new words. In CPA classrooms, about a third to almost half of daily work is designed to trigger transfer.
A student might learn about equal groups with cubes, then face a story about packing muffins, then later solve a time or money problem that uses the same grouping idea. The surface keeps changing, but the model stays steady.
This steady diet teaches students to look past key words and to search for the relationship. In many non-CPA programs, only a small slice of work asks for transfer. Items repeat the same look and feel, so students get fast at that one pattern but freeze when the setting changes.
When transfer is planned and frequent, students build a habit of asking what is this like, which leads to better problem solving and stronger memory.
How to act
Plan for transfer on purpose. After students learn a new idea with blocks and a clear drawing, bring in a brief story that uses the same structure in a very different jacket. Keep numbers friendly and language short so effort goes into seeing the pattern.
Ask students to point to the part of their bar model or array that proves the match between the two problems. Invite a quick reflection at the end where students name the big idea that traveled with them, such as equal parts, comparison, or rate per one.
In small groups, give pairs two short stories that look unlike each other and ask them to show the same model for both. At home, play a simple game called same inside, different outside. You give a story about sharing fruit, your child gives a totally different story about sharing time or money, and both of you draw the same model.
Praise the match more than the final number. If you want easy transfer tasks ready to go, Debsie lessons include quick swaps that bring the same idea into new, everyday scenes so children practice the muscle of moving knowledge across contexts.
29) Use of visual reasoning (diagrams before formulas) — CPA: 60–80% of new lessons; non-CPA: 15–30%
What this means
Pictures make thinking visible. When students begin with a diagram, they can test ideas, catch errors, and choose steps with confidence. In CPA programs, most new lessons open with a visual: a number bond, an array, a double number line, or a bar model.
The drawing is not decoration; it is the engine of reasoning. Students point to parts, label the unknown, and then write equations that fit the picture. Later, formulas feel natural because they come from something students already understand.
In many non-CPA programs, diagrams are rare or appear after a rule has been given. Students try to memorize steps without a map and may get lost when numbers grow or stories twist. Visual first learning lowers anxiety and raises accuracy because the child can see why a step makes sense.
How to act
Lead with a clean diagram whenever you can. Keep shapes simple and labels clear. When teaching multiplication, start with arrays before facts. When teaching ratio, draw double number lines before cross multiplication.
When teaching fraction addition, sketch same-size bars before stacking numerators and denominators. Ask students to explain the picture in words before writing any symbols. Use quick checks like trace with your finger where the answer lives in the drawing.
Only after the class can read the diagram should you introduce the formula, making a clear bridge from picture to symbols. At home, if a problem feels foggy, pause the numbers and ask your child to draw the story. Even a rough sketch can unblock thinking.
Save a small portfolio of good diagrams so your child can revisit them as visual anchors. For families and teachers who want consistent visual routines, Debsie’s curriculum supplies step-by-step diagram prompts that help children move from picture to equation without guesswork.
30) Student success on multi-step word problems at grade level — CPA: 65–80% correct on average sets; non-CPA: 35–55% correct
What this means
This is the outcome that matters most to many parents and teachers. When instruction follows the CPA path and the habits above, students solve hard, real stories much more often. They plan, they draw, they compute, and they check.
On average sets of grade-level, multi-step word problems, classes using CPA approaches land around two thirds to four fifths correct. In contrast, classes without these supports often land near one third to one half correct. The numbers tell a simple truth.
When we give children time to reason, tools to model, and chances to explain, they win more often on the problems that matter. Success here is not only about grades. It is about confidence, stamina, and the belief that math is understandable and useful. That belief changes how a child shows up to every new topic.
How to act
Aim your weekly plan at multi-step success. Build in regular model use, varied practice, and short explanations so the final test is no surprise. Teach students a calm routine for word problems: read to get the story, draw a model, label the unknown, choose operations, estimate, compute, and check whether the answer fits the story.
Keep numbers friendly early so attention goes to planning, then scale up as confidence grows. Track class progress with small, mixed sets every other week and celebrate growth in plan quality, not just in totals.
When a child stumbles, pull them back to the picture and rebuild the plan with simpler numbers rather than reteaching a rule louder. At home, practice one or two multi-step stories three nights a week. Do not rush. Let your child draw and talk first.
Ask where the second step shows in the drawing and whether the answer makes sense. If you would like a guided path to raise multi-step strength, join a free Debsie trial class. Your child will learn the routine, use clear models, and feel success that builds real momentum.
Conclusion
Math can be calm, clear, and joyful when we build it in the right order. The data across these thirty stats points to one strong pattern. When children move from concrete to pictorial to abstract, when we give real time to problem solving, and when we ask for short, honest explanations, success rises.
Students do not just memorize. They understand. They make plans. They check. They grow steady confidence that follows them into the next grade and into daily life. This is what we want for every child.