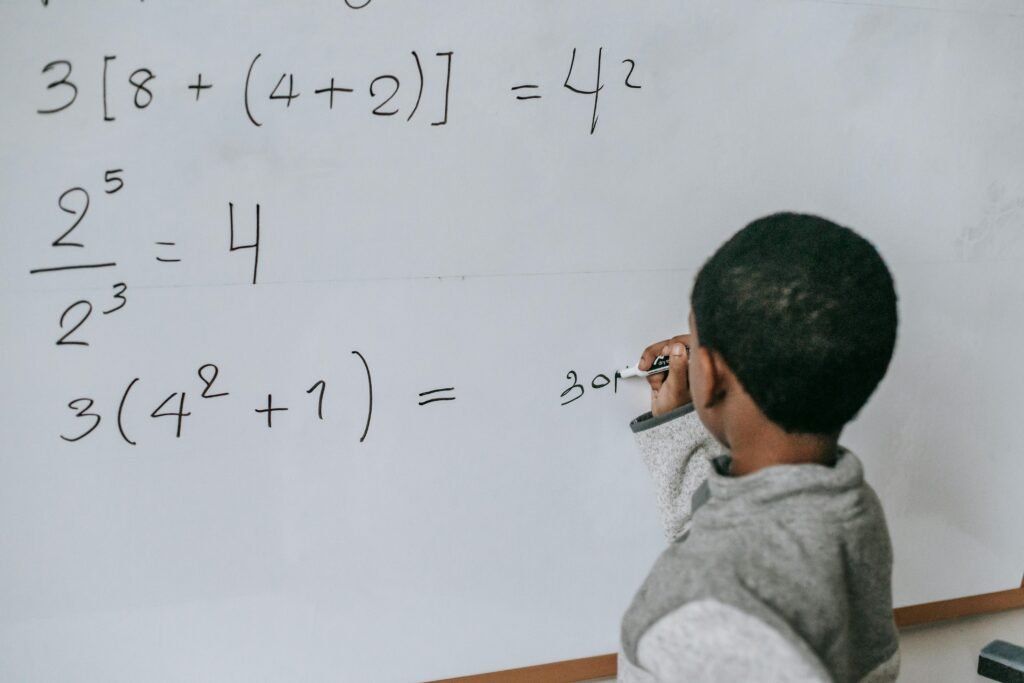
Classrooms have changed. Not long ago, teachers asked a question and waited. A few hands went up. The same confident students spoke. The rest stayed quiet. Some were shy. Some were unsure. Some were simply lost. Today, we have a better way. Classroom Response Systems, also called clickers or live polls, give every student a voice. With one simple tap, each child can answer. No fear. No waiting. No guessing who understands and who does not.
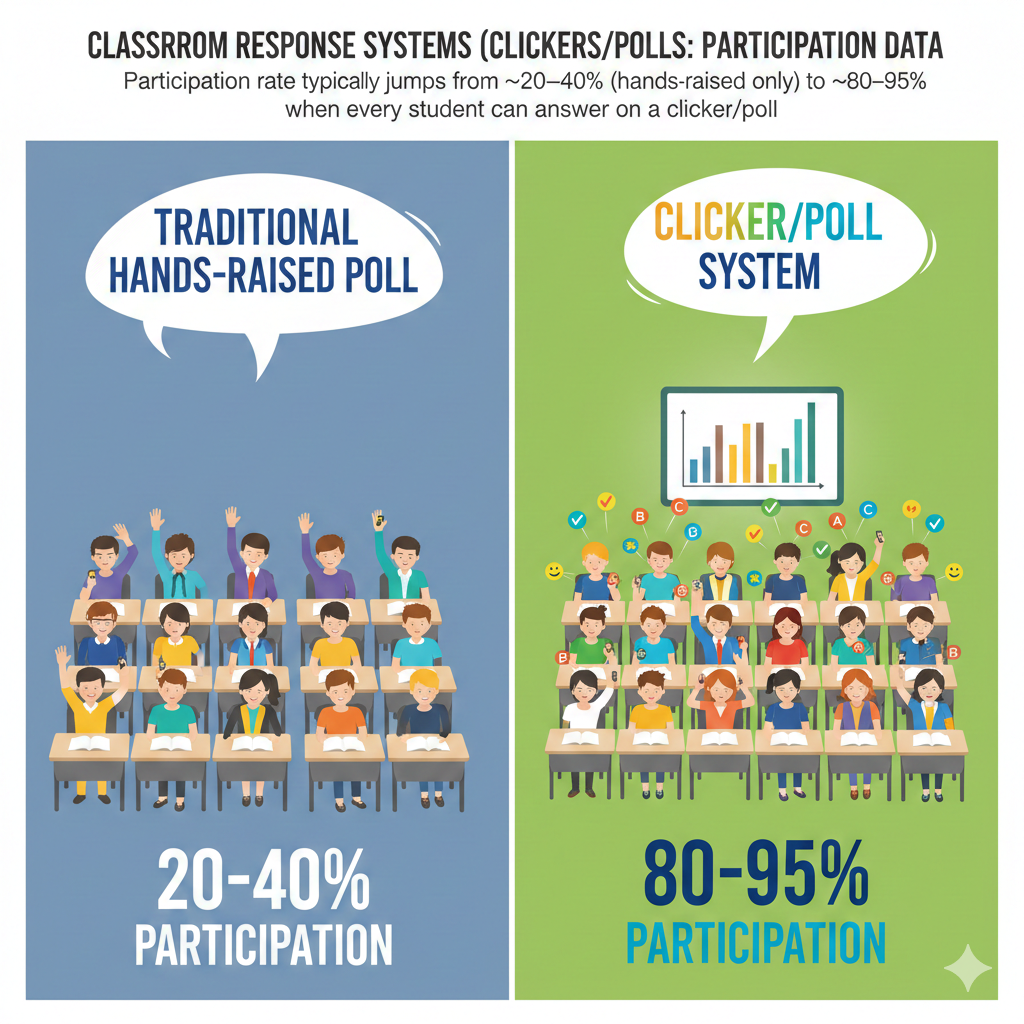
1. Participation rate typically jumps from ~20–40% (hands-raised only) to ~80–95% when every student can answer on a clicker/poll.
Why This Participation Jump Changes Everything
In a traditional classroom, when a teacher asks a question and waits for raised hands, participation is often low. In a class of 30 students, maybe 6 to 10 students raise their hands. That is around 20 to 40 percent of the class.
The rest remain silent.
When a clicker or poll system is introduced, participation often rises to 80 to 95 percent. That means almost every student answers every question.
This is not a small improvement. It is a complete shift in classroom culture.
When every student must respond, engagement becomes normal. It is no longer about who feels brave enough to speak. It is about everyone thinking at the same time. The quiet student in the back row has the same voice as the confident student in the front.
If you want to see this jump happen in your classroom, you must be clear and consistent. Do not ask, “Who wants to answer?” Instead say, “Everyone, please submit your answer now.” That small change makes a big difference.
Keep your poll questions short and focused. If students need more than 30 seconds to answer, you may lose momentum. Quick questions lead to higher response rates.
Also, show the results after each poll. When students see that almost everyone responded, they feel part of a group effort. That feeling builds a strong learning culture.
Track your participation rate weekly. If you see it drop below 80 percent, investigate immediately. Are instructions clear? Is the technology working smoothly? Are students confused?
When participation moves from 30 percent to 90 percent, you are no longer teaching a small group. You are teaching the whole room.
2. Silent students often become active: in many classes, 50–70% of “rare talkers” start responding regularly once answers are anonymous.
How Anonymity Unlocks Hidden Voices
Every classroom has quiet students.
They listen. They think. But they rarely speak.
In a normal hand-raising setting, these students stay invisible. They may understand the lesson. Or they may be completely lost. The teacher cannot always tell.
When classroom polls allow anonymous responses, something powerful happens. Research and classroom data show that 50 to 70 percent of students who almost never speak begin responding regularly when their names are not attached to their answers.
Why does this happen?
Because fear drops.
Students often stay quiet for simple reasons. They are afraid of being wrong. They do not want others to laugh. They do not want to feel embarrassed. Even high-performing students sometimes avoid speaking because they fear mistakes.
Anonymous polling removes that pressure.
If you want to activate your silent students, make anonymity clear. Tell them their individual answers will not be shown to the class. Emphasize that the goal is learning, not judging.
Use anonymous polls especially when asking about confusion. Ask questions like, “How confident do you feel about this topic?” or “Do you need another example?” These questions open the door for honesty.
You should also avoid praising only the highest scorers after a poll. If students feel that only correct answers are celebrated, they may return to silence.
Instead, say things like, “Thank you for answering. Now I know what we need to work on.”
When quiet students begin responding, you gain real insight. You see patterns you never saw before. You notice gaps early. You build trust.
An anonymous tap may seem small, but for many students, it is the first step toward confidence.
3. Anonymity boosts honesty: sensitive or “I’m confused” questions can get 2–3× more responses when names aren’t shown.
Why Students Tell the Truth When They Feel Safe
Students do not always tell the truth in public settings.
If a teacher asks, “Who does not understand this?” very few hands go up. No one wants to admit confusion in front of peers. Even if half the class is lost, only one or two may respond.
But when the same question is asked through an anonymous poll, response numbers can double or even triple. Participation in sensitive questions often increases by two to three times.
This honesty is priceless.
When students feel safe, they reveal real struggles. They admit confusion. They admit low confidence. They admit they need help.
As a teacher, this is gold.
To use this effectively, build regular “confidence check” moments into your lesson. After explaining a key idea, ask students to rate their understanding from one to five. Make sure responses are anonymous. Make it normal to choose lower numbers.

Do not rush past the results. Pause and reflect with the class. If many students report confusion, say calmly, “Thank you for telling me. Let us go through this again.”
Never punish honesty. If students admit confusion and you respond with frustration, you will lose trust quickly.
Also, use anonymous polls for social and emotional check-ins. Ask, “Are you feeling ready to learn today?” These small questions build connection.
Honesty leads to better teaching decisions. Better teaching decisions lead to stronger learning.
When students trust the system, participation becomes real, not forced.
4. Response volume becomes near-universal: a single poll can collect 25–35 answers in a 30-student class, instead of only 3–8 students speaking.
The Power of Hearing From Almost Everyone
Imagine asking a question and receiving 30 answers in less than a minute.
That is what classroom response systems make possible.
In a traditional classroom, only 3 to 8 students may speak during a question cycle. That leaves most students silent. Even if they are thinking, the teacher has no proof.
With a poll, you can collect 25 to 35 responses in a class of 30 students. That means nearly everyone has participated.
This shift changes how lessons feel.
Instead of long waits between speakers, you see instant data. You see patterns. You see whether the class is split between answers. You see whether most students agree.
To make the most of this volume, design strong multiple-choice questions. Each option should represent a common mistake or idea. Do not create random wrong answers. Make each choice meaningful.
When you receive 30 responses, do not simply reveal the correct answer and move on. Study the distribution. If 40 percent chose a specific wrong answer, that tells you something important.
Say, “I see many of you chose option C. Let us talk about why.”
Encourage brief peer discussion before revealing the final answer. This often improves understanding and deepens thinking.
High response volume is not about speed. It is about insight.
When you hear from almost everyone, you stop teaching blindly. You start teaching with clarity.
5. Speed improves: most students can submit an answer in 10–30 seconds, allowing many more check-ins per lesson.
How Fast Responses Create Stronger Lessons
In a normal classroom discussion, one question can take five minutes. A teacher asks. A few hands go up. One student answers. The teacher responds. Another student adds something. Time passes quickly.
With clickers or polls, most students can submit an answer in 10 to 30 seconds.
That speed changes everything.
Instead of asking two big questions in a lesson, you can ask eight or ten short ones. Each question becomes a quick checkpoint. Each checkpoint tells you if students are following along.

This rhythm keeps energy high. Students stay alert because they know a question may come at any time. They do not drift away for long.
To use this speed well, keep questions clear and focused. Avoid long paragraphs. Use simple language. If students must read too much, you lose the speed advantage.
Set a visible timer if possible. When students see that they have 20 seconds, they think faster and stay engaged. Long open-ended waits reduce urgency.
Also, plan your questions before class. Do not rely on random polling. Think about where students might get confused. Insert quick polls right after those moments.
After students answer, react quickly. Show results. Give short feedback. Then move forward.
Fast response does not mean shallow learning. It means frequent learning checks.
When you check understanding often, you reduce surprises on exams. You fix small problems before they grow.
Speed, when used wisely, keeps the lesson alive and focused.
6. More frequent checks happen: teachers often go from 0–2 comprehension checks per class to 4–10 polls in the same time.
Why More Checkpoints Mean Better Teaching
Many teachers check for understanding only once or twice during a lesson. They might ask, “Does everyone understand?” and move on when a few students nod.
But nodding is not data.
When classroom response systems are used well, teachers often increase comprehension checks from one or two per lesson to four, six, or even ten.
This does not make the class slower. It makes it smarter.
Frequent checks create a feedback loop. You teach a concept. You ask a question. You see the results. You adjust. Then you continue.
Without these checks, teachers often discover misunderstandings too late. By the time a test arrives, gaps are deep.
To increase your check frequency, break your lesson into small chunks. Teach for 7 to 10 minutes. Then ask a focused question about the key idea. Keep it direct.
Avoid using polls only for review at the end. The true value is during the lesson, not after.
You should also vary question types. Sometimes ask about facts. Sometimes ask about reasoning. Sometimes ask students to predict what will happen next.
The goal is not to catch students making mistakes. The goal is to guide them step by step.
When you check more often, students stay mentally active. They cannot drift for long because another question is coming.
Frequent checks create a culture of thinking.
Instead of guessing how the class is doing, you know.
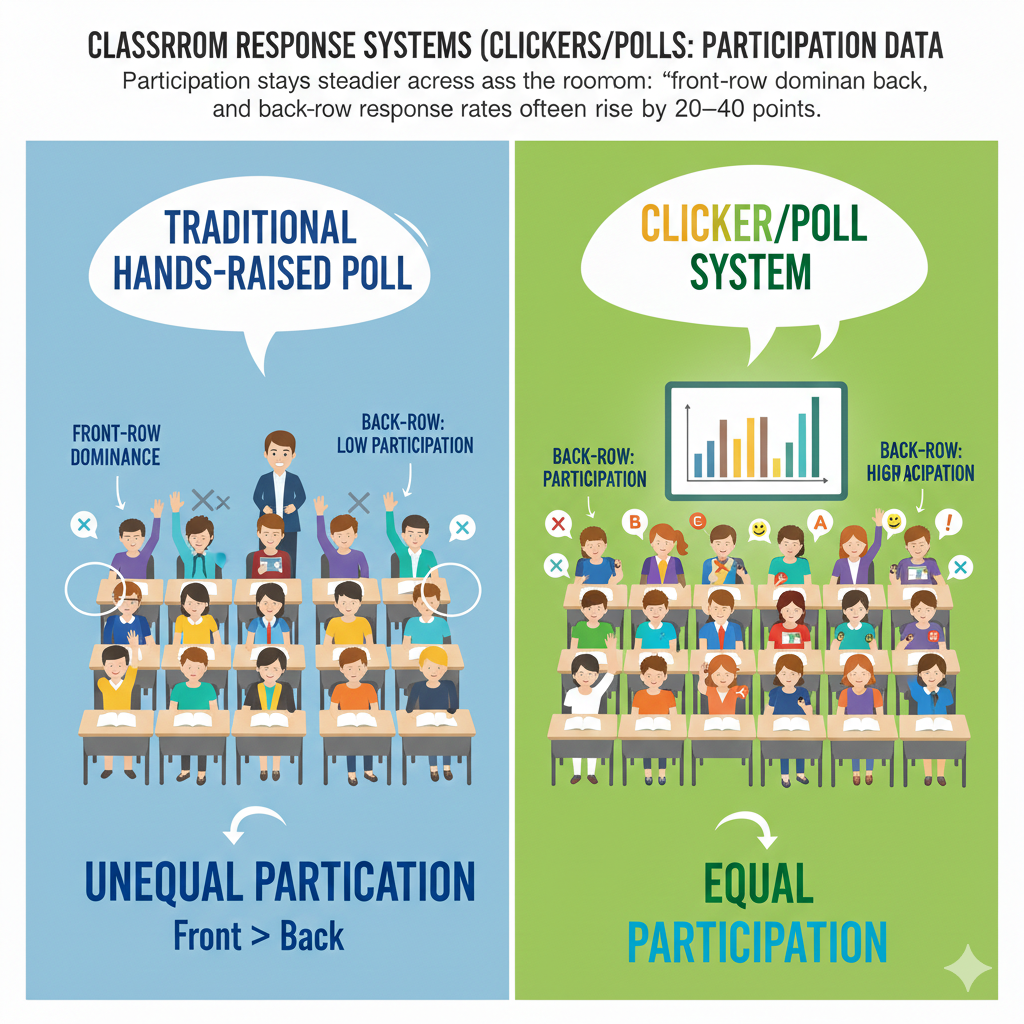
7. Participation stays steadier across the room: “front-row dominance” drops, and back-row response rates often rise by 20–40 points.
How Clickers Create Equal Participation
In many classrooms, the front row speaks the most. These students are often confident, engaged, or simply closer to the teacher.
Students in the back rows speak less. Sometimes they feel less noticed. Sometimes they prefer to stay quiet. Sometimes they feel disconnected.
When clickers or polls are introduced, this imbalance shrinks. Data often shows that back-row participation rates can rise by 20 to 40 percentage points. The gap between front and back becomes much smaller.
This matters more than many people realize.
When only certain parts of the room participate, learning becomes uneven. Teachers may unconsciously focus attention on the most active area.
Clickers level the field.
Every student responds from their seat. Location no longer controls voice.
To strengthen this effect, avoid walking only toward students who usually speak. After a poll, move around the room evenly. Make eye contact with different sections.
If your system allows it, review participation data by seating chart. Look for patterns. Are certain areas still less active? If so, consider adjusting seating arrangements or group structures.
You can also follow up polls with small group discussions that mix front and back students together. This spreads energy and confidence.
Equal participation builds fairness. Fairness builds trust.
When every seat in the room counts, students feel that their thinking matters.
And when students feel that their thinking matters, they think more.
8. Equity improves: the gap between high-participation and low-participation students can shrink by 30–60% when everyone must tap an answer.
How Required Responses Close the Participation Gap
In many classrooms, participation is uneven. A small group answers most questions. Another group rarely speaks. Over time, this gap grows wider. Confident students grow more confident. Quiet students grow more distant.
When classroom response systems require every student to submit an answer, this gap can shrink by 30 to 60 percent.
That is not a small improvement. That is a culture shift.
When everyone must tap an answer, participation becomes a shared responsibility. No one can hide behind silence. At the same time, no one is exposed in front of peers.
To make this work, you must set the expectation clearly from day one. Tell students that responding is part of learning, not optional. Keep the tone calm and steady. Do not threaten. Simply make it normal.
Also, track patterns quietly. If certain students consistently miss responses, speak with them privately. Ask what is happening. Sometimes it is confusion. Sometimes it is technical issues. Sometimes it is focus.
You should also mix difficulty levels. If every poll is too hard, low-confidence students may mentally give up. Include easier questions that allow all students to experience success.
Equity does not mean lowering standards. It means giving everyone equal opportunity to engage.
When participation gaps shrink, classroom energy changes. Students feel that learning is shared. Teachers see a fuller picture of understanding.
And when everyone participates, growth becomes possible for everyone.
9. Attendance vs participation separates clearly: it’s common to see 5–15% of students physically present but not responding—data makes this visible.
Why Being in the Room Is Not the Same as Learning
A student can sit in a classroom and still not engage.
Without data, teachers may assume that physical presence equals participation. But classroom response systems often reveal something surprising. Even when attendance is high, 5 to 15 percent of students may not respond to polls.
They are there, but they are not thinking.
This insight is powerful because it removes guesswork. You no longer assume engagement. You can see it.
If you notice consistent non-response from certain students, act early. Do not wait until exam results show failure.
First, check technical issues. Make sure devices are working. Then observe behavior. Are students distracted? Tired? Confused?
Have quiet one-on-one conversations. Avoid accusing language. Instead of saying, “Why are you not answering?” say, “I noticed you missed a few questions. Is something getting in the way?”

You may discover simple problems that are easy to fix.
Also, create small participation incentives. Even minimal participation credit can reduce non-response rates. But keep the focus on learning, not points.
You can also build short reflection moments. After a few polls, ask students to think about their own engagement. Self-awareness increases responsibility.
Participation data shines light on hidden disengagement.
When you separate attendance from true involvement, you can address problems early.
A student sitting quietly is not always learning.
Now you can know the difference.
10. Engagement decay becomes measurable: without interactive prompts, attention can drop after 10–15 minutes; polls often “reset” attention for many students.
How Timed Polls Restore Focus
Human attention has limits.
After 10 to 15 minutes of listening without interaction, many students begin to drift. Eyes glaze over. Minds wander. Even strong students struggle to stay focused.
Before response systems, teachers had little proof of this drop. Now it becomes visible.
When lessons include no interaction, participation rates in later questions often fall. But when a poll is introduced right before attention drops, something interesting happens. Engagement rises again. The poll acts like a reset button.
To use this wisely, plan your lesson in short segments. Teach for about 10 minutes. Then pause for a poll. The question does not need to be complex. It can simply ask students to apply what they just learned.
This small action pulls minds back into the room.
Avoid long lecture blocks without interaction. Even if the content is strong, attention will weaken.
You can also use prediction questions before moving to a new concept. Ask students what they think will happen next. This creates curiosity and focus.
Watch your data carefully. If response speed slows or non-response increases, attention may be fading. Insert a quick interactive moment.
Engagement is not constant. It moves up and down.
Polls help you manage that rhythm.
Instead of hoping students stay focused, you actively bring them back.
When you control attention, you control learning.
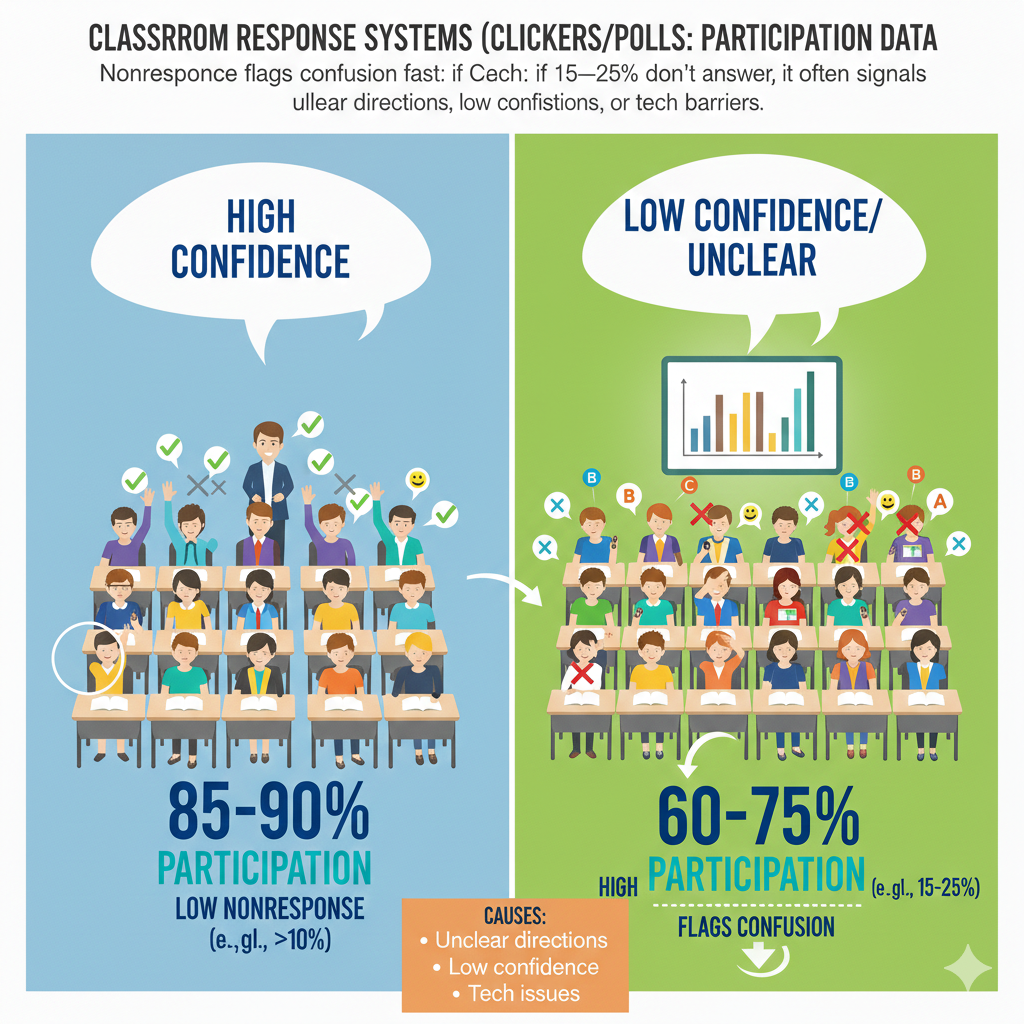
11. Nonresponse flags confusion fast: if 15–25% don’t answer, it often signals unclear directions, low confidence, or tech barriers.
What Silence Is Really Telling You
When 15 to 25 percent of students do not answer a poll, that is not random. It is a signal.
Silence in a digital system is data. It usually points to one of three problems. The directions were unclear. The question felt too hard. Or there was a technical issue.
Many teachers focus only on correct versus incorrect answers. But nonresponse can be even more important.
If you see a sudden drop in response rate, pause immediately. Do not continue the lesson as planned. Ask calmly, “Was the question clear?” or “Do you need me to explain that again?”
Sometimes students are confused but do not want to choose a wrong answer. They freeze instead. Other times they may not understand what is being asked.
Keep your instructions short. Display them clearly. Read them out loud once. Then give students a moment before starting the timer.
Also, check your technology regularly. Slow systems reduce trust. If students believe their answer may not register, they may stop trying.
You can also add a simple option like “I am not sure.” This reduces fear and encourages honest responses instead of silence.
Nonresponse should never be ignored. It is early warning data.
When you respond quickly to silence, you prevent confusion from growing.
Silence is not nothing. It is information waiting for attention.
12. Guessing shows up in the distribution: for 4-option multiple choice, random guessing produces about 25% correct—useful as a baseline.
How to Read the Numbers Behind the Answers
In a four-option multiple-choice question, random guessing produces about 25 percent correct answers.
This number matters.
If you ask a question and 26 percent of students answer correctly, that is not success. That may simply reflect guessing. On the other hand, if 70 percent answer correctly, real understanding is likely present.
Participation data helps you compare results to this guessing baseline.
When results hover near 25 percent, stop and reteach. Do not move forward. That level suggests widespread confusion.
When results fall between 40 and 60 percent, the class may be divided. This is a powerful moment for peer discussion. Ask students to briefly talk with a neighbor about their reasoning. Then repoll. You will often see a clear rise in correct answers.
When results reach 80 percent or higher, you may be ready to increase difficulty.
Design your wrong answer options carefully. Each one should reflect a common mistake. This helps you diagnose thinking patterns. If many students choose the same wrong option, that reveals a shared misunderstanding.
Avoid trick questions. The goal is clarity, not confusion.
Use the 25 percent baseline as a mental guide. It keeps you honest about what the data truly shows.
Numbers tell a story. Learn to read it well.
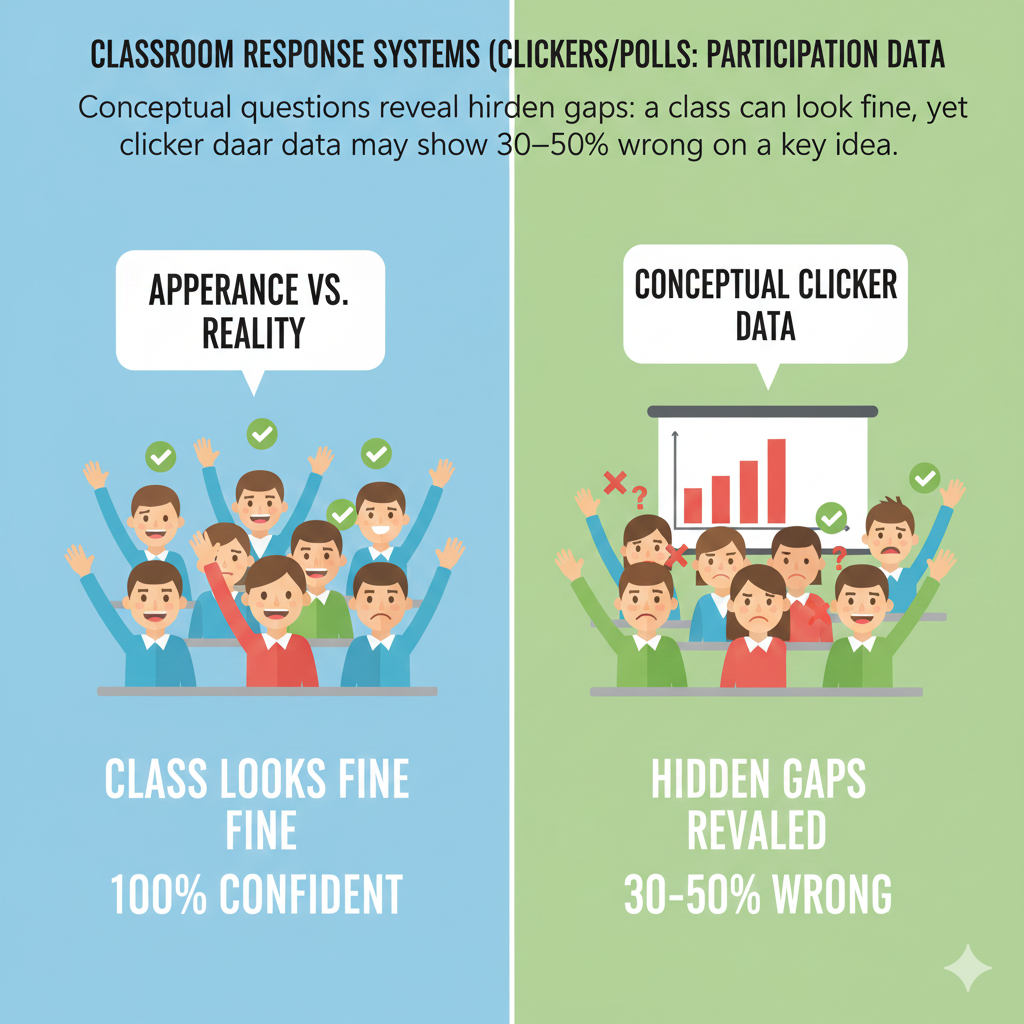
13. Conceptual questions reveal hidden gaps: a class can look fine, yet clicker data may show 30–50% wrong on a key idea.
Why Surface Confidence Can Be Misleading
Sometimes a lesson feels smooth. Students nod. A few answer correctly out loud. Everything appears fine.
Then you run a conceptual poll.
Suddenly, 30 to 50 percent of the class selects the wrong answer.
This is one of the greatest strengths of classroom response systems. They reveal hidden gaps.
Surface participation can be misleading. Confident students may answer correctly, while many others quietly misunderstand.
To uncover real understanding, ask conceptual questions, not just factual ones. Instead of asking for definitions, ask students to apply ideas in new situations. Ask them to predict outcomes. Ask them to explain reasoning through answer choices.
If half the class selects a wrong concept, do not treat it as failure. Treat it as discovery. You have found a weak point before it becomes permanent.
Pause and unpack the misunderstanding. Show why the wrong option seems tempting. Then explain the correct reasoning clearly.
After reteaching, ask a similar question again. This second poll shows whether learning has improved.
Hidden gaps are dangerous when unseen. They grow quietly and appear later in exams or advanced topics.
Clicker data brings these gaps into the light.
When you teach based on real understanding rather than appearance, your classroom becomes stronger and more honest.
14. Peer discussion can shift results strongly: after 1–2 minutes of discussion, correct responses often rise by 10–30 percentage points.
How Short Conversations Create Big Learning Gains
One of the most powerful moments in a classroom happens after a split vote.
You ask a question. The results show that only 55 percent chose the correct answer. The class is divided.
Instead of giving the answer right away, you tell students to turn to a partner and discuss their thinking for one or two minutes.
Then you poll again.
In many classrooms, correct responses rise by 10 to 30 percentage points after that short discussion.
Why does this happen?
Because students explain ideas in simple language to each other. They hear different reasoning. They compare logic. This process sharpens thinking.
To use peer discussion well, choose questions that create meaningful disagreement. If 95 percent already know the answer, discussion will not add much. But when results are mixed, that is the perfect time.
Give clear instructions. Tell students to explain why they chose their answer, not just what they chose. Encourage them to listen before changing their mind.
Keep the discussion short. One to two minutes is enough. Longer conversations can drift off-topic.
After the second poll, highlight the improvement. Say, “Look at the shift. That is learning happening in real time.”
Do not shame those who changed their answers. Changing your mind after new information is a sign of growth.
Peer discussion combined with polling turns the classroom into a thinking space, not just a listening space.
Learning becomes active and shared.
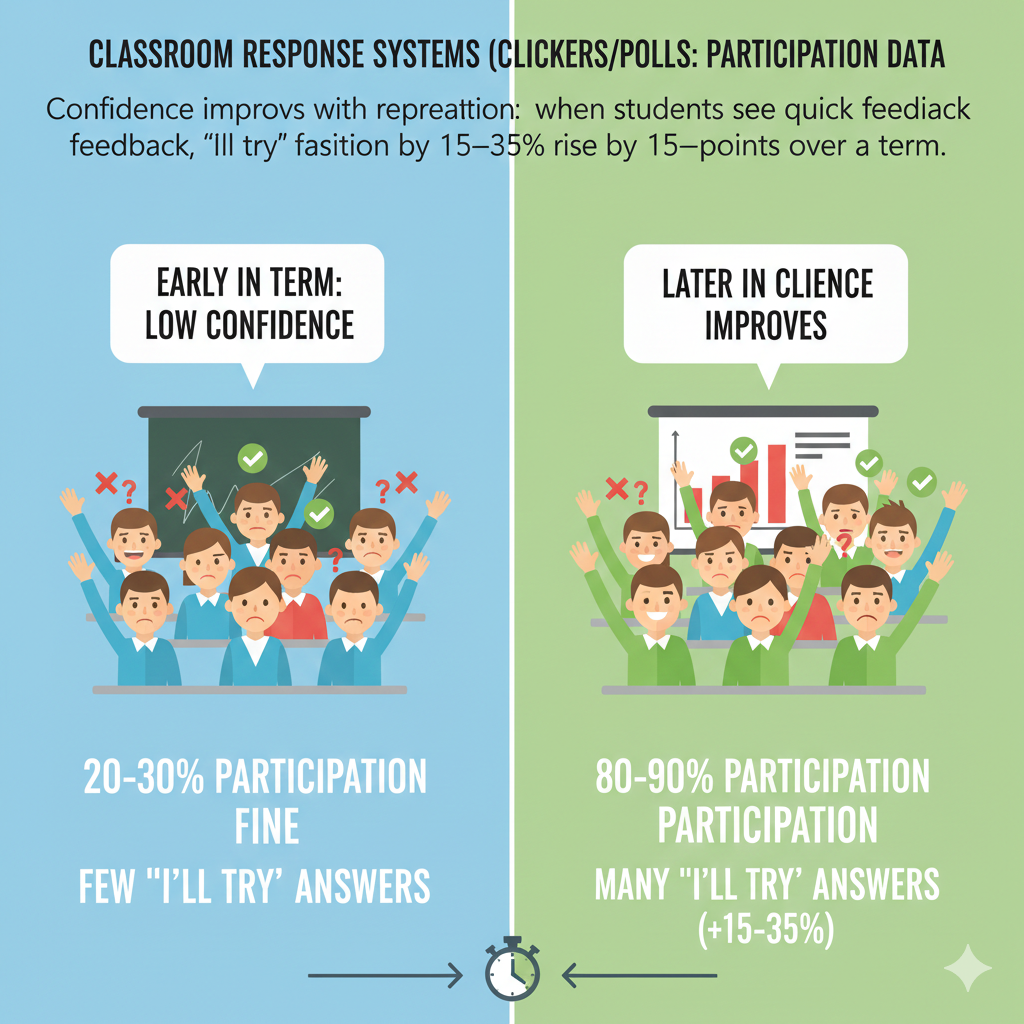
15. Confidence improves with repetition: when students see quick feedback, “I’ll try” participation can rise by 15–35 points over a term.
How Fast Feedback Builds Courage
Confidence does not grow overnight.
In classrooms that use regular polling with immediate feedback, participation from hesitant students often rises by 15 to 35 percentage points over a school term.
The reason is simple.
Students answer. They see results quickly. They realize mistakes are normal. They notice improvement over time.
This steady cycle builds courage.
If you want to grow confidence, make feedback immediate. After each poll, show results. Briefly explain the correct reasoning. Keep the tone supportive, not critical.
Avoid saying things like, “You should already know this.” Instead say, “This is a common mistake. Let’s look at it together.”
Also, mix difficulty levels. If every question is extremely hard, students may feel defeated. If every question is too easy, growth stalls. Balance is key.
You can also show progress across weeks. For example, compare early results on a topic with later results. Let students see their improvement.
Encourage risk-taking. Remind students that trying is more important than being right every time.
Confidence grows when effort feels safe.
Over time, hesitant students begin to think, “I’ll try.” That small mindset shift changes everything.
When students believe they can improve, participation becomes natural.
16. Participation correlates with performance: students who respond to 80%+ of polls often score higher by a noticeable margin than those responding below 50%.
Why Engagement Predicts Achievement
Participation is not just about behavior. It connects directly to performance.
Classroom data often shows that students who respond to 80 percent or more of polls tend to score higher on tests and assignments than those who respond to less than 50 percent.
This does not mean polling alone creates high grades. It means engagement supports understanding.
When students respond regularly, they think more often. They check their understanding. They receive feedback. They correct mistakes early.
All of this builds stronger knowledge over time.
If you track participation data, look for patterns. Identify students with low response rates early in the term. Do not wait for poor exam results.
Meet with them privately. Ask simple questions. Are they distracted? Do they feel confused? Are they unsure how to use the system?
Sometimes small habits make a big difference. Encourage these students to commit to answering every question for one week. Help them build routine.
Also, show students the connection between engagement and results. Without sharing private data, explain that consistent participation often leads to better outcomes.
Make participation part of the learning culture, not a punishment system.
When students understand that thinking often leads to stronger results, they begin to take responsibility.
Participation is not just clicking a button.
It is active thinking.
And active thinking leads to real progress.
17. Early warning is possible: students responding to under 40–50% of polls in the first weeks are often at higher risk of falling behind.
How Participation Data Helps You Intervene Early
The first few weeks of a course tell you more than you think.
When a student responds to fewer than 40 to 50 percent of polls early in the term, that pattern often predicts future struggle. Low response rates usually mean low engagement, confusion, or low confidence.
This is not about labeling students. It is about noticing trends before they turn into academic problems.
Without participation data, teachers often discover issues after the first major test. By then, gaps are wider and harder to close.
With clicker data, you can act early.
Review response rates weekly. Look for students consistently below the class average. Do not wait for the number to drop even further.

Schedule short, supportive conversations. Keep your tone calm and curious. You might say, “I noticed you have missed several poll questions. I want to make sure everything is okay.”
Sometimes students admit they feel lost. Sometimes they are distracted. Sometimes they simply did not realize participation mattered.
Set small, clear goals. For example, ask the student to respond to every poll in the next three classes. Celebrate improvement.
You can also pair low-response students with reliable peers during discussions. Positive peer influence often increases engagement.
Early intervention prevents long-term frustration.
Participation data acts like a dashboard warning light. It tells you something needs attention.
If you respond quickly, you can change a student’s path before failure becomes a pattern.
18. Attention checks are effective: simple “Are you with me?” polls can push response rates back up by 10–25 points right after a dip.
How Quick Check-Ins Restore Energy
Every lesson has slow moments.
You may notice students becoming quiet. Fewer eyes are focused. Response speed drops. Participation dips.
Instead of pushing forward, use a simple attention check.
A quick poll like, “Are you ready to continue?” or “Which part was most confusing?” can raise response rates by 10 to 25 percentage points right after a decline.
This works because it resets attention.
Students who were drifting suddenly need to tap an answer. That small action brings their focus back to the lesson.
Do not overcomplicate attention checks. Keep them short and direct. The goal is re-engagement, not deep analysis.
You can also use light prediction questions before introducing new content. Curiosity increases alertness.
If you notice response times getting slower, treat it as feedback. It may mean you have spoken too long without interaction.
Plan attention checks ahead of time, especially in longer classes. Insert them at natural transition points.
After the poll, acknowledge the class. Say something like, “Thank you. Let’s move forward together.”
This reinforces shared responsibility for focus.
Attention is not constant. It needs to be guided.
Simple polls act like small sparks that relight the room.
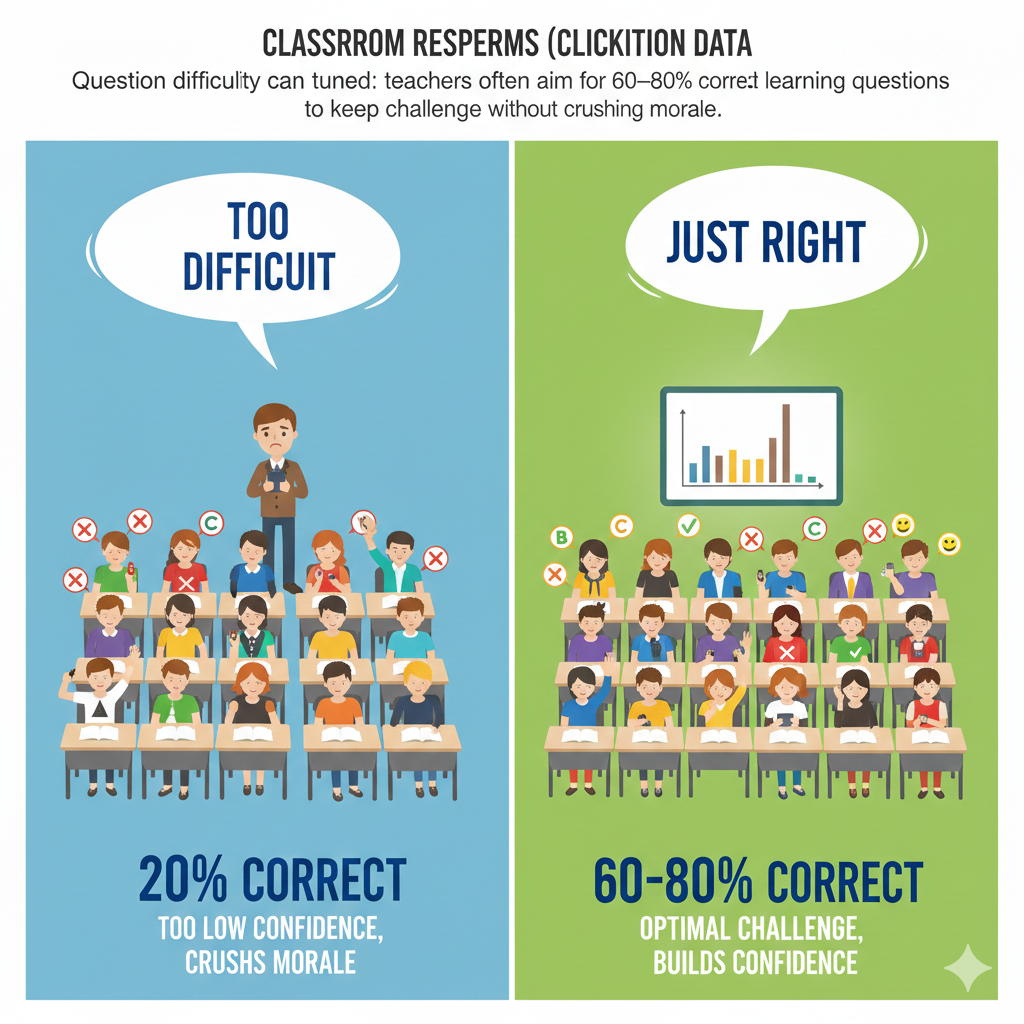
19. Question difficulty can be tuned: teachers often aim for 60–80% correct on learning questions to keep challenge without crushing morale.
Finding the Right Level of Challenge
If 95 percent of students answer correctly every time, the questions may be too easy. If only 20 percent answer correctly, they may be too hard.
Many experienced teachers aim for 60 to 80 percent correct responses on learning questions. This range keeps students challenged but not discouraged.
When about two-thirds of the class gets a question right, you have room for discussion. Some students understand. Others are unsure. This creates productive tension.
Use participation data to adjust difficulty in real time.
If results are consistently above 90 percent, increase complexity. Ask deeper reasoning questions. Combine concepts.
If results fall near guessing levels, simplify. Break the concept into smaller steps. Provide more examples.
Avoid making every poll high-stakes. Learning questions should stretch thinking, not punish mistakes.
You can also explain to students why challenge matters. Tell them that struggle is part of growth. When they see that moderate difficulty is intentional, they become more patient.
Balance is key.
Questions that are too easy create boredom. Questions that are too hard create fear.
Participation data helps you stay in the middle.
When challenge feels fair, students stay motivated.
And motivated students keep responding.
20. Participation spikes with stakes: adding even tiny points like participation credit can lift response rates by 5–15 points.
How Small Incentives Change Behavior
Students respond to expectations.
When polls are purely optional and carry no weight at all, some students slowly stop taking them seriously. But when even a small participation credit is attached, response rates often increase by 5 to 15 percentage points.
The key word here is small.
You do not need to attach heavy grading pressure. In fact, that can backfire. A light participation score simply signals that engagement matters.
If you choose to add points, keep the system simple. Award credit for responding, not for being correct every time. The goal is thinking, not perfection.
Explain clearly how participation credit works. Be transparent. Students respect clear systems.
Avoid making every single poll graded. Instead, set a simple expectation such as responding to a certain percentage of polls over the week.
You should also monitor behavior. If students rush through questions without thinking just to earn credit, slow the pace slightly. Add occasional follow-up discussion to deepen reasoning.
Remember that incentives are tools, not solutions. The real goal is intrinsic motivation. Students should value engagement because it helps them learn.
Small participation credit can act as training wheels. Over time, many students continue responding even without strong grading pressure.
When used carefully, light stakes create consistency.
And consistency builds stronger learning habits.
21. Too much grading can reduce honesty: if every poll is graded, genuine “I don’t know” answers can drop by 10–20%.
Why Safety Must Come Before Scores
While small incentives can improve response rates, too much grading can hurt honesty.
When every poll is heavily graded for correctness, students become cautious. Instead of choosing what they truly think, they may guess strategically. In some classrooms, honest “I don’t know” responses drop by 10 to 20 percent under strict grading systems.
This weakens the value of participation data.
If students are afraid of losing points, they stop revealing confusion. That makes it harder for teachers to diagnose real problems.
To avoid this, separate learning polls from assessment polls. Use most clicker questions for practice and understanding checks. Keep them low-stakes or participation-based.
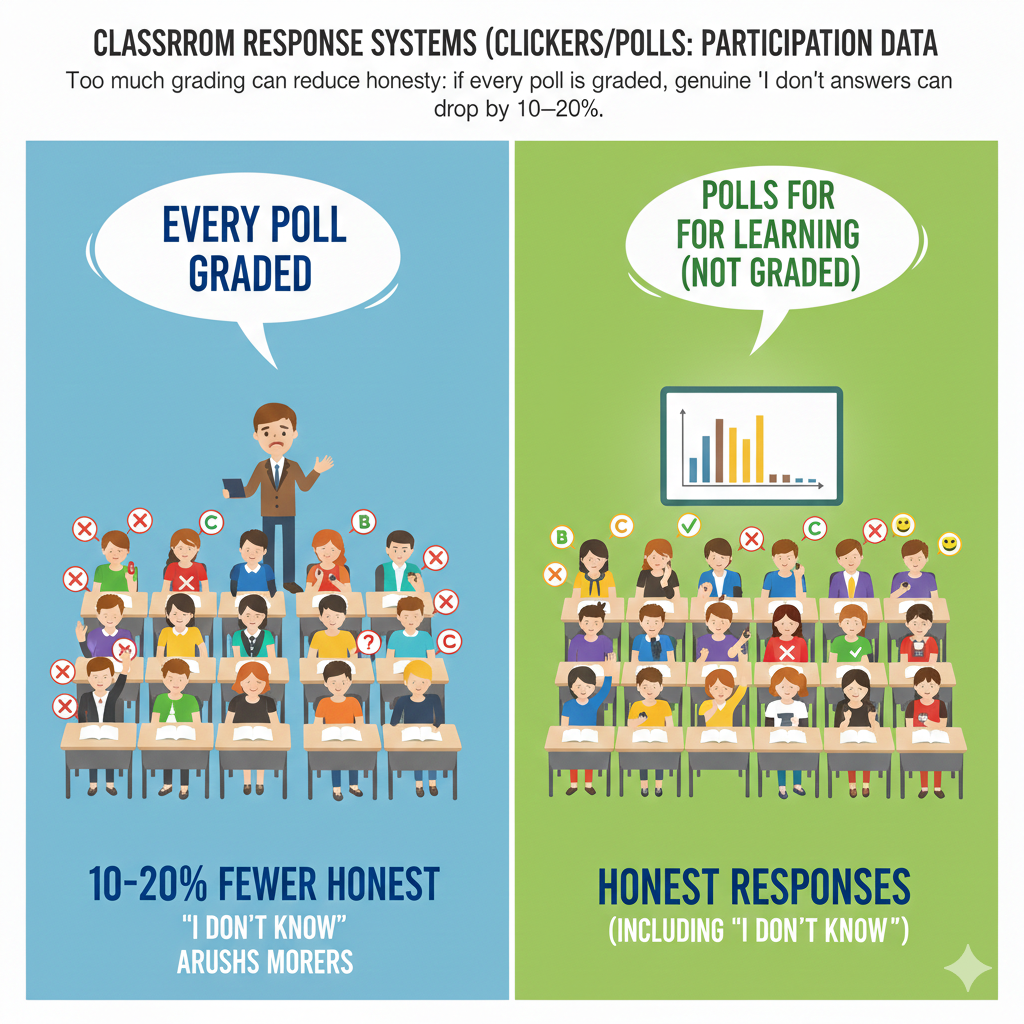
Reserve graded accuracy for occasional quizzes, not daily learning questions.
You can also include an answer option like “I am unsure.” Do not punish it. Instead, treat it as useful feedback.
Remind students often that mistakes are part of learning. Repeat this message in different ways throughout the term.
If you notice unusual answer patterns, such as extreme clustering on safe options, reflect on whether grading pressure is influencing behavior.
Honest data leads to better teaching decisions.
When students feel safe admitting confusion, you gain clear insight.
Safety supports truth.
And truth supports growth.
22. Open-text polls get 10–30% fewer replies than multiple choice due to typing effort.
When and How to Use Open Responses Wisely
Open-text questions are powerful. They allow students to explain reasoning in their own words. They reveal deeper thinking.
However, participation data often shows that open-text polls receive 10 to 30 percent fewer responses than simple multiple-choice questions.
Why?
Typing takes more time. It requires more effort. Some students hesitate because they worry about spelling or wording.
This does not mean you should avoid open questions. It means you should use them wisely.
Use multiple-choice questions for quick checks and high participation. Use open-text questions for deeper reflection at key moments.
Keep open responses short. Instead of asking for a full paragraph, ask for one sentence. Clear limits reduce hesitation.
Provide reassurance. Tell students that grammar is not the focus. The goal is ideas.
You can also allow short discussion before open-text submission. Talking first helps students organize their thoughts.
If participation drops too low during open responses, follow up with a simpler multiple-choice question to re-engage the full class.
Balance is important.
Multiple-choice questions build broad engagement. Open-text questions build depth.
When used together, they create a strong learning system.
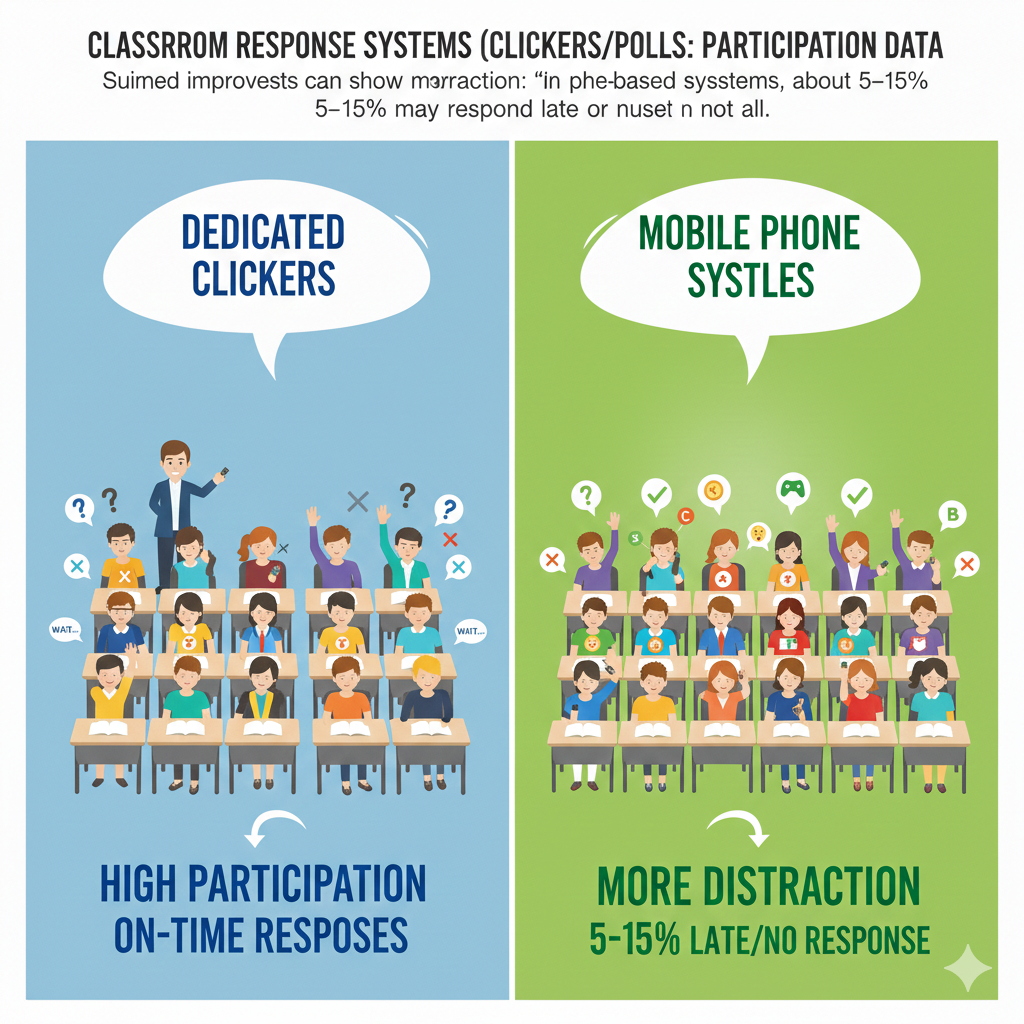
23. Mobile polls can show more distraction: in phone-based systems, about 5–15% may respond late or not at all.
Managing Distraction in Device-Based Classrooms
When students use their own phones for polling, convenience increases. There is no extra hardware. Setup is simple.
But participation data often shows a small challenge. Around 5 to 15 percent of students may respond late or miss questions entirely in phone-based systems.
The reason is not always confusion. It is distraction.
Phones carry messages, notifications, and social media. Even focused students can lose attention for a moment.
This does not mean mobile polling should be avoided. It simply requires structure.
Start by setting clear device expectations. Before class begins, explain that phones are learning tools during polling time. Keep instructions calm and firm.
Ask students to silence notifications. Model this behavior yourself if possible.
Keep polling windows short. If a question stays open too long, attention drifts. A focused 20-second response window maintains urgency.
Move around the room while polling is active. Physical presence reduces off-task behavior.
If you notice consistent late responses from certain students, speak privately. Do not accuse. Ask if they are experiencing technical delays or distractions.
You can also mix in moments where devices are face down when not in use. Clear transitions reduce constant screen checking.
Technology can support engagement, but only with clear routines.
Structure protects focus.
And focus protects learning.
24. Late responses are common: even when most answer quickly, 10–20% may submit after the main wave.
Understanding Response Timing Patterns
In most classrooms, when a poll opens, the majority of students respond quickly. Within the first 10 to 20 seconds, most answers are submitted.
However, participation data often shows that 10 to 20 percent of students respond later than the main group.
This is not always a problem.
Some students process information more slowly. Others double-check their thinking before submitting. Careful thinkers may simply need more time.
The key is to balance speed with fairness.
Set a clear but reasonable time limit. Avoid rushing too quickly. If you always close polls after 10 seconds, slower processors may feel stressed.
Watch response flow over time. If the late group consistently struggles, consider whether questions are too complex or instructions unclear.
You can also signal when time is almost up. A simple verbal reminder such as “Five more seconds” helps students pace themselves.
Do not shame late responders. Respect different thinking speeds.
However, if late responses are extremely delayed or inconsistent, check for attention issues or device problems.
Response timing tells you about classroom rhythm. It reveals how students process information.
When you understand timing patterns, you can design smoother learning experiences.
Balance urgency with patience.
That balance builds trust.
25. Participation differs by time of day: morning vs late-day classes can show 5–15 point differences in response rates.
Adjusting Strategy Based on Energy Levels
Energy changes throughout the day.
Morning classes may begin slowly as students wake up. Afternoon classes may struggle with fatigue. Participation data often shows 5 to 15 percentage point differences depending on time of day.
This variation is normal.
Instead of expecting identical engagement in every session, adjust your strategy.
For early classes, begin with a simple warm-up poll. Ask an easy review question to build momentum. Early success wakes up thinking.
For late-day sessions, increase interaction frequency. Shorter teaching segments with more polls help fight tiredness.
Pay attention to response speed. If answers are slower in the afternoon, shorten explanations and increase active moments.
You can also vary question types based on energy. Use more prediction and application questions when alertness is higher. Use structured review questions when energy is lower.
Avoid blaming students for natural energy cycles. Instead, design around them.
Participation data gives you clear feedback. If response rates dip at certain times, adapt your lesson flow.
Teaching is not only about content. It is about timing.
When you align your strategy with daily rhythms, participation improves naturally.
And steady participation supports steady learning.
26. In very large lectures, clickers can take participation from single-digit speakers to hundreds of responders per question.
Turning Massive Rooms Into Active Learning Spaces
Large lecture halls often struggle with participation.
In a class of 200 or 300 students, only a few may speak during a traditional question. Sometimes just three or four voices dominate the entire session. The rest sit quietly. The teacher has little idea who understands the material.
Clickers or live polling systems completely change this dynamic.
Instead of hearing from five students, you can collect responses from 180 or more within seconds. Participation jumps from single digits to hundreds of voices at once.
This transforms the atmosphere.
Students no longer feel invisible in a crowd. Each person has a channel to think and respond. The teacher sees patterns instantly across the whole room.
If you teach large groups, structure becomes essential. Plan polling moments carefully. Display questions clearly on large screens. Keep instructions simple.
In big rooms, peer discussion is even more powerful. After an initial poll, ask students to turn to someone nearby and compare reasoning. Then repoll. The visible shift in answers energizes the room.
Also, project response distributions immediately. When students see hundreds of responses appear in real time, it creates a shared learning moment.
Large lectures can feel passive and distant. Polling tools shrink that distance.
Even in a room of 300, each student can think, decide, and contribute.
Scale no longer limits engagement.
With the right structure, large classrooms can feel interactive and alive.
27. Warm-up polls at the start of class can increase later participation by 5–20 points in that same session.
Starting Strong to Sustain Engagement
The first five minutes of class set the tone for everything that follows.
When a lesson begins with a warm-up poll, participation throughout the session often increases by 5 to 20 percentage points.
Why does this happen?
Because students immediately shift into active mode. Instead of slowly settling in, they begin thinking right away.
A warm-up poll does not need to be complex. It can review yesterday’s topic. It can ask a simple prediction. It can even check confidence levels.
The key is early engagement.
When students respond at the start, they understand that participation is expected. The mental shift happens immediately.
To maximize impact, display results and briefly discuss them. Acknowledge patterns. Celebrate strong recall or clarify confusion quickly.
Avoid starting with long announcements or extended lecturing. These passive openings reduce early energy.
You can also use warm-up data to adjust your lesson. If many students struggle with a review question, spend a few extra minutes reinforcing that concept.
Starting strong builds momentum.
Momentum builds consistency.
And consistent engagement leads to deeper learning throughout the class.
A simple two-minute poll at the beginning can shape the entire session.
28. Misconceptions become trackable: if a wrong option is chosen by 25–40% repeatedly, it signals a strong misunderstanding that needs reteaching.
Using Answer Patterns to Diagnose Thinking
When a wrong answer attracts 25 to 40 percent of the class, that is not random.
It signals a shared misconception.
This is one of the most valuable insights participation data provides. Instead of guessing where students are confused, you can see it clearly in the answer distribution.
If the same incorrect option appears repeatedly across multiple questions, take it seriously.
Do not simply correct it and move on.
Pause and explore why that option feels appealing. Often, misconceptions are rooted in partial understanding. Students may be applying a rule incorrectly or missing a key condition.
Address the misunderstanding directly. Show examples that contrast the correct reasoning with the mistaken logic. Ask students to explain why the wrong option seems tempting.
Then test again with a similar but slightly varied question. Watch whether the misconception decreases.
Tracking misconceptions over time is powerful. Keep informal notes. If a specific misunderstanding appears across weeks, design a focused mini-lesson around it.
Avoid blaming students for errors. Treat misconceptions as natural steps in learning.
Participation data gives you patterns, not just scores.
When you respond thoughtfully to these patterns, you strengthen conceptual understanding.
Misconceptions hidden in silence can last for months.
Misconceptions revealed through polling can be corrected in minutes.
29. Participation improves when feedback is shown immediately: displaying results can increase next-question response rates by 5–10 points.
Why Instant Feedback Drives Continued Engagement
Students want to know if their thinking makes sense.
When you ask a poll question and immediately display the results, something important happens. Participation in the very next question often rises by 5 to 10 percentage points.
This may seem small, but it is meaningful.
Instant feedback closes the learning loop. Students see how their answer compares with others. They see whether the class agrees or is divided. Curiosity increases.
If results are hidden or delayed, engagement drops. Students feel like their response disappeared into a void.
To use this well, always plan time to show results. Do not rush past them. Even 30 seconds of reflection is enough.
After displaying results, guide attention. If most students answered correctly, briefly confirm why. If answers are mixed, pause for discussion. If many selected a wrong option, unpack the misunderstanding.
The key is visibility.
When students see the collective response, they feel part of a learning community. They understand that their click mattered.
Also, maintain a calm tone when results show confusion. Never react with frustration. Say, “This is helpful. Now we know what to work on.”
Students quickly learn that polls are tools for growth, not judgment.
Consistency matters. When students know results will always be shared, they stay attentive.
Immediate feedback keeps momentum alive.
And momentum sustains participation across the lesson.
30. Consistency matters: when polls are used regularly, participation stabilizes near 80–95% instead of swinging widely week to week.
Building a Reliable Culture of Engagement
The final and most important insight is this.
Consistency shapes behavior.
When classroom response systems are used randomly, participation fluctuates. One week engagement is high. The next week it drops. Students are unsure what to expect.
But when polls are used regularly and predictably, participation stabilizes between 80 and 95 percent.
Students adapt to routine.
If they know that every lesson includes active response moments, they prepare mentally. Engagement becomes habit.
To build this stability, create a clear structure. For example, start each class with a warm-up poll. Include two to four checks during instruction. End with a reflection question.
Keep the pattern steady across weeks.
Avoid long gaps without polling. When tools disappear for extended periods, engagement habits weaken.
You should also reflect on your own consistency. Are questions prepared ahead of time? Are instructions clear each day? Do you always close the loop with feedback?
Predictability builds trust.
When students trust the system, they participate without hesitation.
Over time, the classroom shifts from reactive to proactive. Engagement no longer depends on mood or topic. It becomes part of the culture.
Stable participation creates stable learning growth.
When 80 to 95 percent of students are thinking, responding, and receiving feedback every lesson, the classroom becomes a place of active progress.
Participation data is not just numbers on a screen.
It is a mirror of engagement.
Conclusion
Classroom Response Systems do something very simple, yet very powerful.
They make every student respond.
Not just the confident ones.
Not just the fast thinkers.
Not just the students in the front row.